



Tesla Stock Price Forecast: Q3 Profit Slump Sends Shares Down Nearly 5%, May Continue to Test $300 Mark
Tesla 2026 Stock Price Trend Review
TradingKey - Entering 2026, Tesla (TSLA) stock experienced a year marked by extreme volatility and strategic transformation, undergoing two rounds of declines followed by recoveries, but so far it remains down, with a year-to-date drop of nearly 16%.
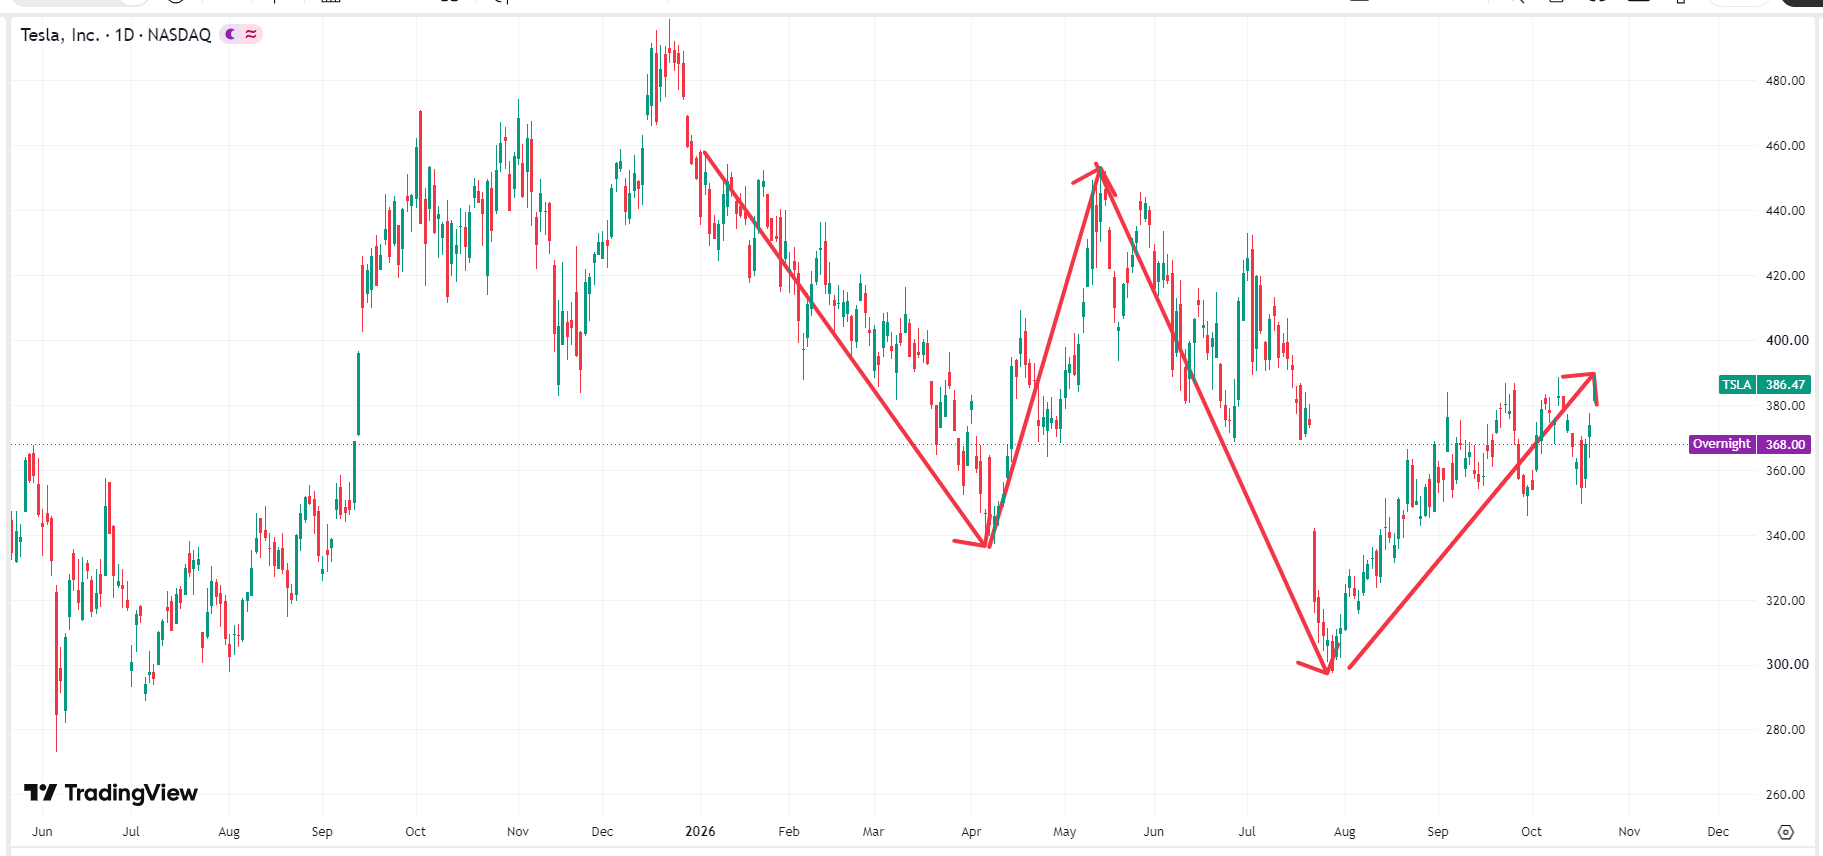 Tesla stock price chart, Source: TradingView
From January to March, Tesla's stock price did not continue its 2025 rally, but instead trended downward, steadily dropping from a high of $450 to near a low of $340. From April to May, supported by strong institutional buying, Tesla's stock price rebounded continuously, surging forcefully on heavy volume to $450 in mid-May.
From June to July, Tesla's stock price fluctuated lower again, once falling below the $300 mark and touching a full-year low of $297 on July 29. From August to October, after hitting an extreme bottom, long-term value recovery buying quickly flooded in, forcefully reclaiming the $380 mark in October.
What Factors Drive Tesla's Stock Price Volatility?
The reasons for Tesla's two sharp drops during the year were not the same: the former was mainly due to macroeconomic factors, while the latter was driven primarily by earnings margin pressure. In the first quarter, U.S. Treasury yields surged and macro tech stocks underwent valuation de-rating, leading investors to sell off Tesla as well; meanwhile, Tesla's global electric vehicle (EV) delivery data showed a seasonal slowdown, sparking market doubts over automotive price wars and margin compression, causing the stock price to decline wave after wave. From June to July, the company significantly raised CapEx spending on AI computing clusters and the Optimus humanoid robot, weighing on single-quarter operating margins; furthermore, the high capital expenditures triggered panic selling regarding free cash flow by short-term quantitative funds and hedge funds.
Tesla's first stock rally during the year was due to improvements in supply chain costs and capacity utilization, which boosted automotive gross margin; furthermore, the upgrade of the FSD V13/V14 large model and the landing of pilot operation permits for Robotaxis in certain regions significantly raised Wall Street's pricing of its AI/autonomous driving premium. The second round of gains was linked to computing power procurement with SpaceX, smooth progress in trial runs for Optimus mass production, as well as Elon Musk's business empire merger committee.
Will Tesla Stock Fall Further?
Although Elon Musk's announcement of a "SpaceX + xAI + Tesla Merger Committee" brought a massive long-term AI/aerospace premium, Tesla faces substantial challenges from plummeting profits and CapEx expansion. In the short term, pressure remains for a pullback to retest lows and volatile consolidation, and the stock price could still continue to slide.
On October 20, Musk confirmed the formation of the merger committee during SpaceX's quarterly earnings call, seeking to integrate SpaceX and xAI into Tesla's corporate structure. This brought a massive long-term AI/aerospace premium driven by "satellite-to-ground networking + computing power + edge robotics," leading to a brief rise in Tesla's stock price.
However, Tesla's Q3 financial report showed that its operating profit plummeted 56% year-over-year, with an operating margin of only about 2.6%, stalling the stock's rebound. In addition, elevated macro inflation data drove a rebound in U.S. Treasury yields. High-P/E, high-beta tech stocks across the market faced pressure from macroeconomic de-valuation, and with a forward P/E as high as 300x+, Tesla became one of the primary targets of market sell-offs.
Where Is Tesla's Next Line of Defense?
From a technical perspective, Tesla's stock price has broken below the 0.382 Fibonacci retracement level. The next line of defense is near $340 at the 0.236 Fibonacci level, which also serves as the lower boundary of the September-October consolidation range and a high-volume chip concentration zone. However, if this line of defense fails to hold, the stock will seek a second line of defense at the $300 psychological milestone, which is also Tesla stock's low for the year.
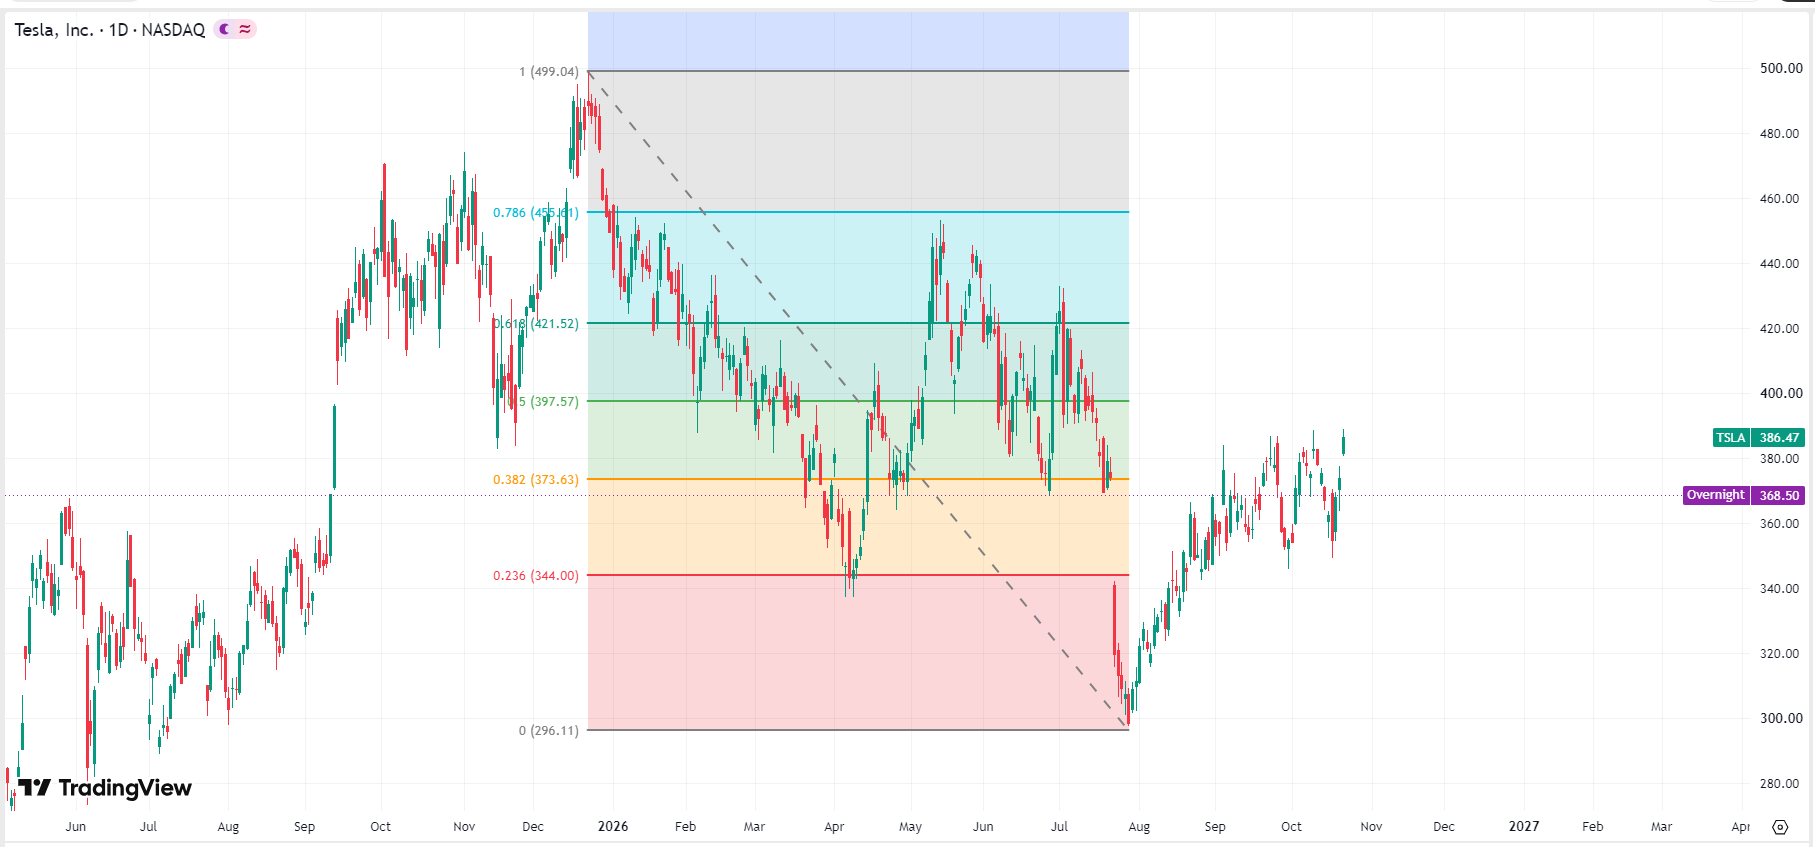 Tesla stock price chart, Source: TradingView
Although Tesla's stock price faces heavy downside pressure, if a high-volume lower shadow signaling a bottoming out appears near $370 in October, it would indicate that the market has rapidly digested short-term concerns over Q3 profit declines and the merger deal, allowing bulls to rebuild a base here.
Nothing in this material constitutes investment advice, personal recommendation, investment research, an offer, or a solicitation to buy or sell any financial instrument. The content has been prepared without consideration of your individual investment objectives, financial situation, or needs, and should not be treated as such.
Past performance is not a reliable indicator of future performance and/or results. Forward-looking scenarios or forecasts are not a guarantee of future performance. Actual results may differ materially from those anticipated.
Mitrade makes no representation or warranty as to the accuracy or completeness of the information provided and accepts no liability for any loss arising from reliance on such information.
Recommended Articles


