



Chevron Stock Forecast: CVX Hits a Record Before Q3 as Investors Wait for Bigger Buybacks
TradingKey - Chevron (NYSE: CVX) rose 0.99% to $231.46 on Thursday, October 29, and climbed to $235.67 in premarket trading, above its 52-week high of $234.08. The oil major reports third-quarter results before the open today, Friday, October 30, with the call at 11 a.m. ET.
The stock is up more than 50% this year as Brent crude trades near $110 a barrel, up from about $72 before the Iran war began in late February. It now sits right at its $232.50 average analyst target, so the report needs to show why the stock can go higher, and buybacks may matter more than EPS.
What Wall Street Expects
Analysts expect adjusted EPS of about $4.87 on revenue of about $61.8 billion, according to MarketBeat, up from $1.85 and $48.2 billion a year earlier. Chevron has beaten EPS estimates in seven of its last eight quarters.
Why Q3 Could Look Weaker Than Q2
Even with oil high, the consensus sits about 20% below Q2's adjusted EPS of $6.06. In August, Chevron guided to 150,000 to 200,000 barrels of oil equivalent a day of upstream turnarounds and downtime, meaning planned maintenance that cuts output, plus a $175 million to $225 million hit to downstream earnings. Timing effects, accounting swings tied to derivatives and inventory, lifted Q2 earnings by $1.4 billion compared with a year earlier, and they can move either way.
Q2 Set a High Bar
In Q2, Chevron earned $6.06 a share on an adjusted basis, beating the $5.55 estimate, as revenue jumped 51% to $67.2 billion. Production rose 20% to 4.07 million barrels of oil equivalent a day, helped by the former Hess assets, and Chevron cut debt by a record $8.4 billion. It also reached $1.5 billion of annual Hess synergies, 50% above its first target, and hit its $3 billion cost-savings goal six months early.
Buybacks Are the Real Test
Chevron guided Q3 buybacks to $2.5 billion to $3.0 billion, near the low end of its $10 billion to $20 billion annual range. In September, CFO Eimear Bonner said extra cash will go back to shareholders and that it is "not a matter of if, it's a matter of when," but added that Chevron generally does not "like to move the buyback rate during times of volatility."
Analysts expect $42.9 billion of free cash flow, the cash left after capital spending, this year, and Chevron produced $16.6 billion in the first half, according to Yahoo Finance. That implies about $13 billion a quarter in the second half, far more than the current buyback pace. In my view, a higher buyback is the clearest way for Chevron to justify a price above its average target.
Analysts and Risks
BofA raised its target to $252 from $227 with a Buy rating, while Morgan Stanley lifted its target to $226 from $218. The stock trades at about 12 times forward earnings. The main risk is that oil falls back as quickly as it rose. Analysts see EPS dropping from about $17 this year to about $14 in 2027, according to TIKR, so 2026 may prove to be a peak year.
Chevron Technical Analysis: Daily Close Above $233.65 Could Open $240.83
Ahead of the report, the daily chart shows a steady uptrend. CVX has climbed inside a rising channel, two parallel lines that contain a trend, since July, and earlier this month it broke above the $217.94 resistance zone. It trades well above the 50-day and 100-day EMAs, moving averages that give more weight to recent prices, which keeps buyers in control.
RSI, a momentum gauge that runs from 0 to 100, is near 69, just below 70, the usual overbought line. The MACD, a trend-following momentum indicator, is still positive but flattening, so a short pause is possible after the report.
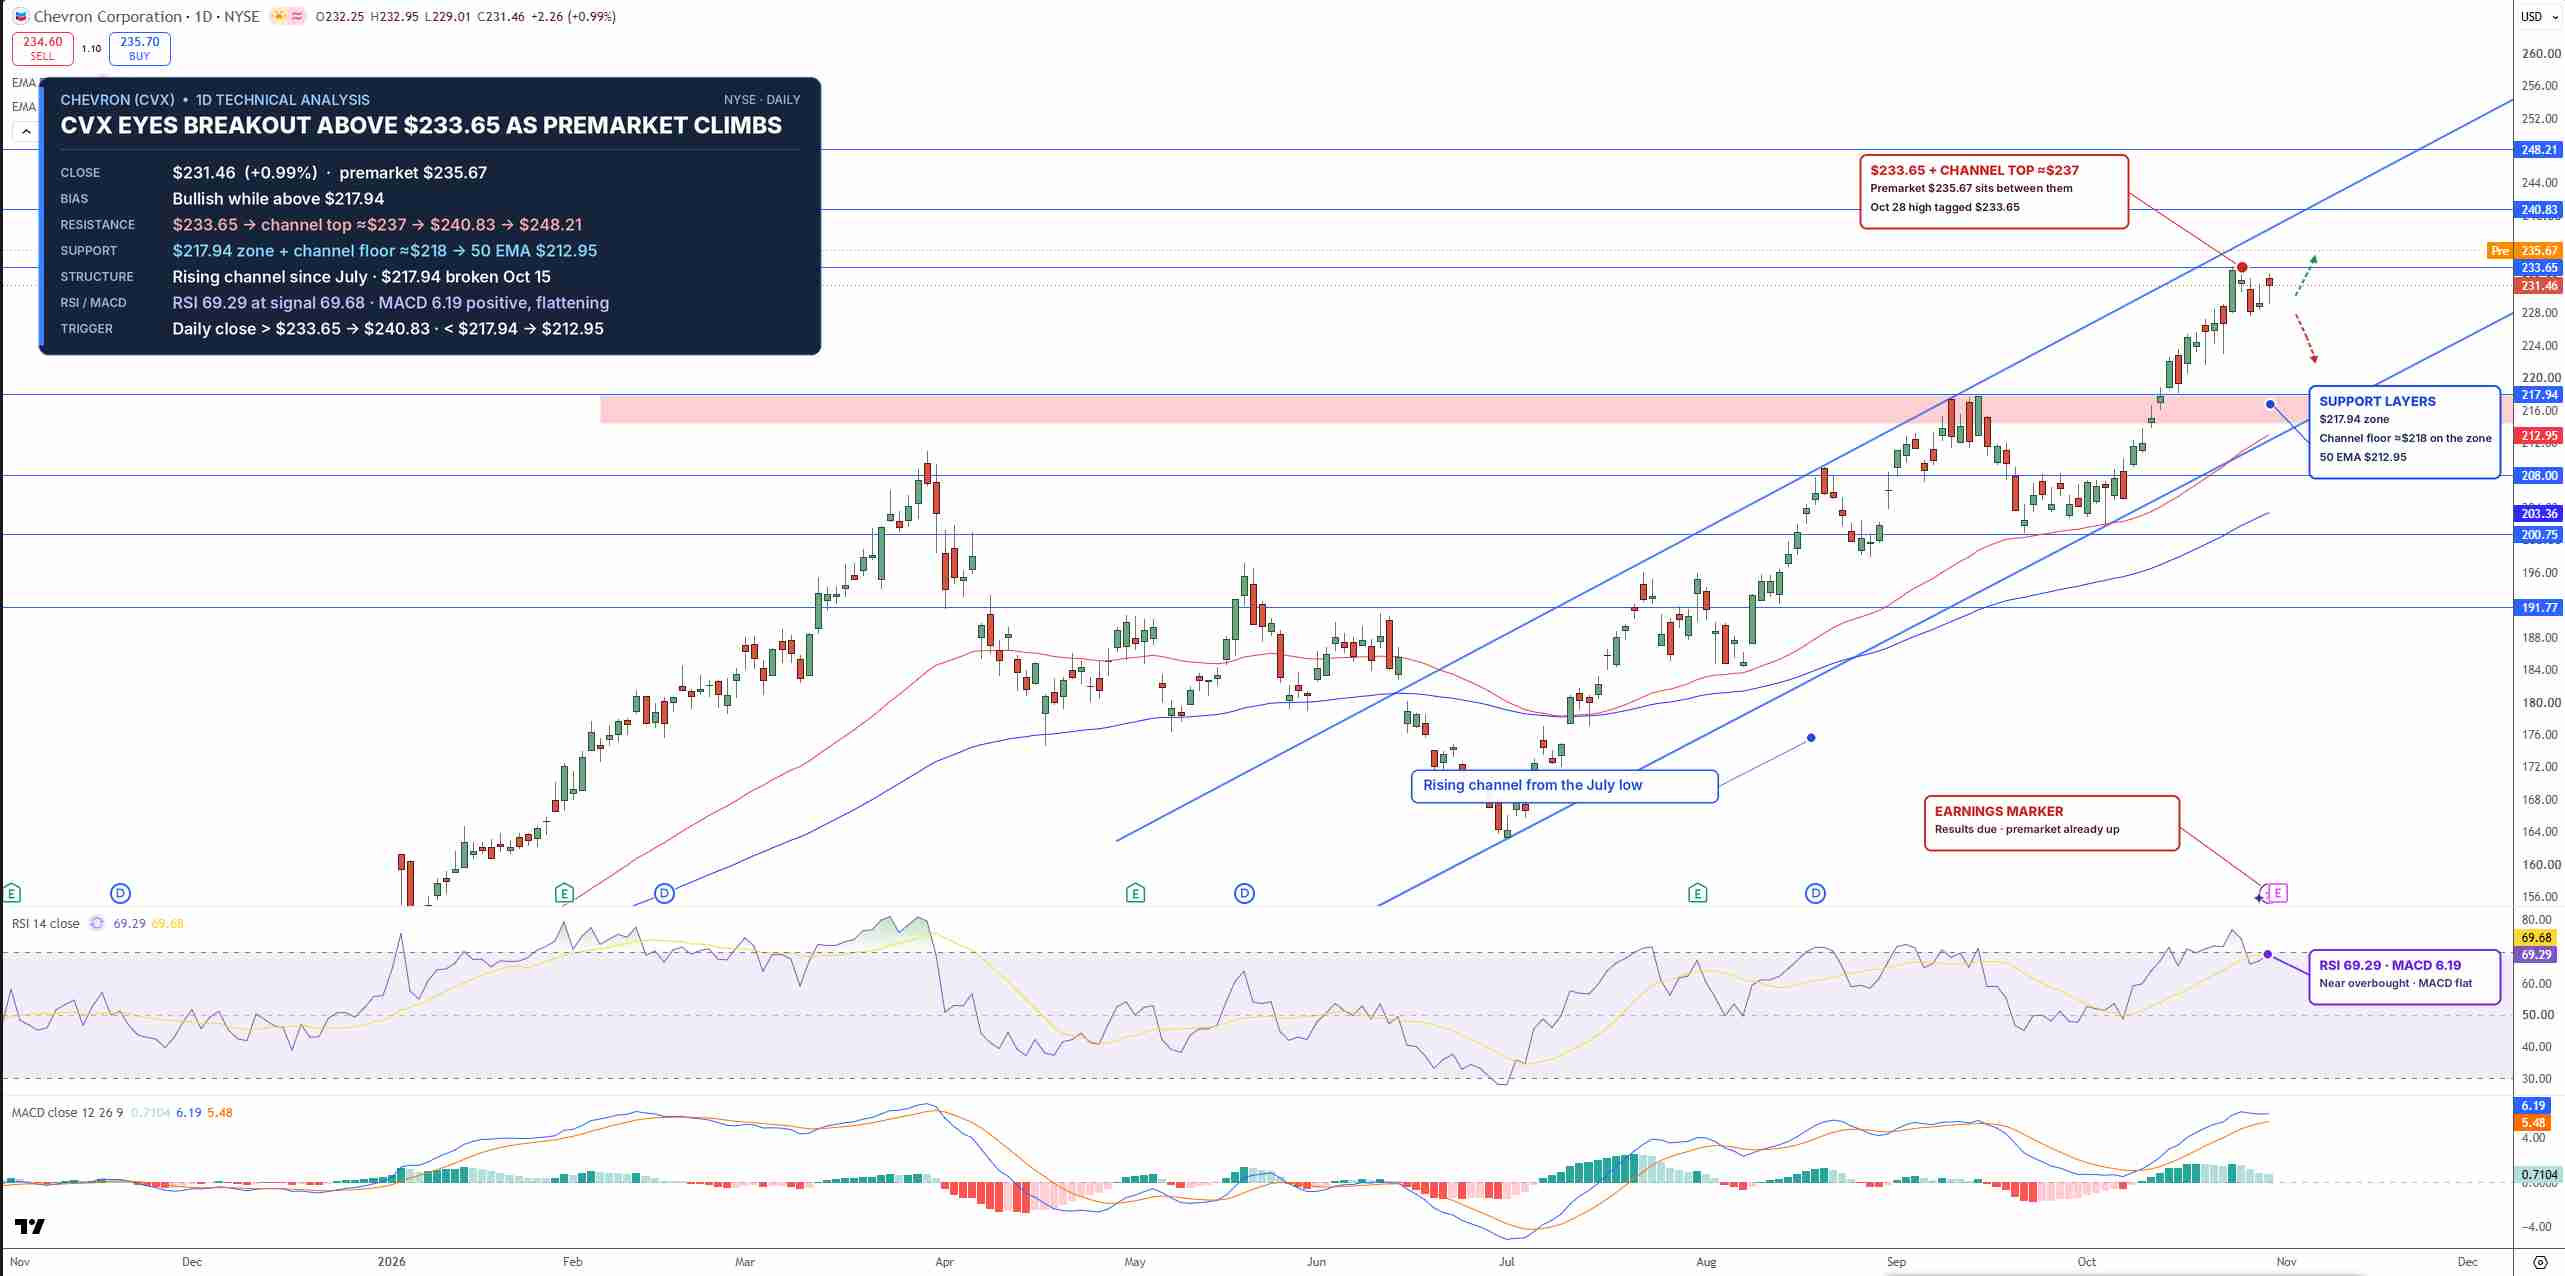
CVX Price Chart - Source: Tradingview
If the premarket gain holds, a daily close above $233.65 would open the way for $240.83, then $248.21. On the downside, $217.94 is key support now that it has flipped from resistance, and a close below it would put the $212.95 50-day EMA in play.
I'm bullish while CVX holds above $217.94, with targets at $240.83 and $248.21.
Key Levels
- Last close: $231.46, up 0.99% on October 29 (premarket: $235.67)
- Support: $217.94, $212.95, $203.36
- Resistance: $233.65, $240.83, $248.21
- RSI: 69.29, just below the 70 overbought line
- Bullish trigger: Daily close above $233.65
- Bearish trigger: Daily close below $217.94
FAQs
When does Chevron report Q3 2026 earnings?
Chevron reports third-quarter results before the US open on Friday, October 30, 2026, with the call at 11 a.m. ET. Analysts expect adjusted EPS of about $4.87 on revenue of about $61.8 billion.
What is the Chevron stock forecast before earnings?
The bias is bullish above $217.94 on the daily chart. A daily close above $233.65 targets $240.83 and $248.21, while a close below $217.94 opens $212.95.
Bottom Line
Chevron is producing far more cash than it returns, and the stock already trades at its average target. The level that matters is $233.65. I expect a daily close above it only if Chevron signals bigger buybacks, while a drop below $217.94 would end the uptrend that started in July.
Nothing in this material constitutes investment advice, personal recommendation, investment research, an offer, or a solicitation to buy or sell any financial instrument. The content has been prepared without consideration of your individual investment objectives, financial situation, or needs, and should not be treated as such.
Past performance is not a reliable indicator of future performance and/or results. Forward-looking scenarios or forecasts are not a guarantee of future performance. Actual results may differ materially from those anticipated.
Mitrade makes no representation or warranty as to the accuracy or completeness of the information provided and accepts no liability for any loss arising from reliance on such information.
Recommended Articles


