



Nokia Shares Extend Three-Day Rally to Reclaim $8, Poised to Gain Over 10% in Near Term
TradingKey - On November 10 Eastern Time, shares of Nokia (NOK) rose 0.86% to close at $8.25, after touching an intraday high of $8.39, with trading volume of approximately 57.26 million shares. Previously, on November 5, NOK plunged 9.69% in a single day to hit a low of $7.36, followed by a three-day rebound that gained roughly 12% from its recent low. In the latest overnight trading, the stock rose further to near $8.50, improving its short-term technical posture, though it has yet to fully break out of its medium-term corrective structure.
The recent sustained rebound in Nokia's share price has been driven primarily by a broader recovery in tech stocks, a technical bounce following prior oversold conditions, and expectations of growth in its AI business. On November 9, NOK's U.S. ADR gained 6.79% to $8.18, marking its second straight session of gains and outperforming the broader market over the same period.
From a fundamental perspective, the company's third-quarter revenue from AI and cloud customers surged 123% year-over-year, with related order intake reaching €1.5 billion, up 118% year-over-year, indicating that AI data center construction is generating fresh demand for its optical communications and IP networks businesses. In addition, Moody's recently upgraded Nokia's long-term credit rating from Ba1 to an investment-grade Baa3 while maintaining a positive outlook, which has also provided support for market confidence.
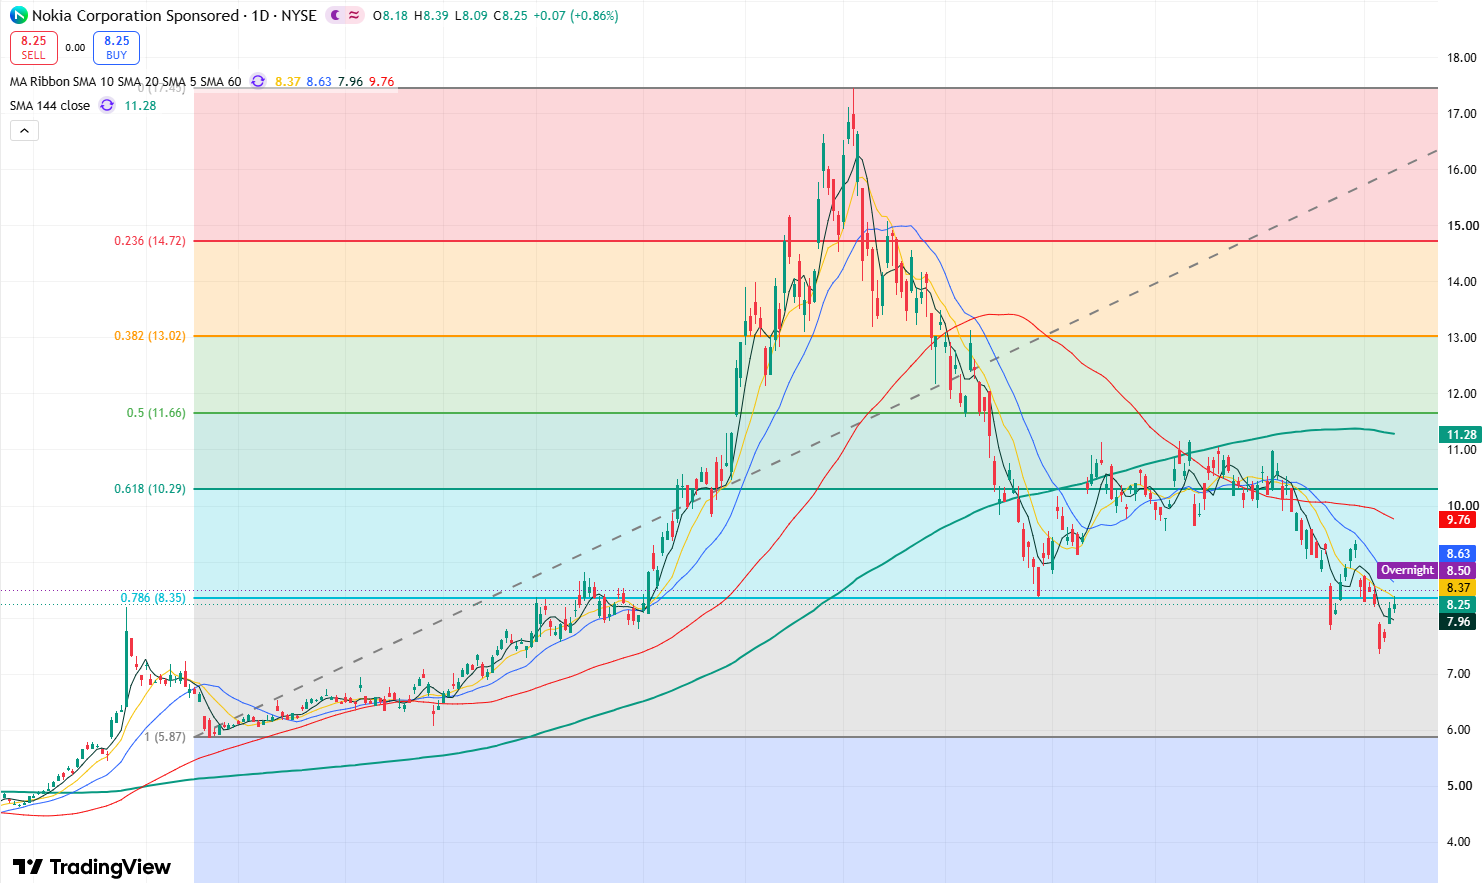
Nokia Daily Stock Chart, Source: TradingView
Looking at Nokia's daily stock chart, shares have rebounded for three consecutive trading sessions following November 5 and have now reclaimed the 5-day moving average. Meanwhile, the stock climbed above $8.50 in after-hours trading during the previous session. If today's open extends this momentum, the stock will climb back above its 10-day moving average, repairing its short-term bullish structure and setting the stage for further upside in the near term.
At present, if today's open extends Wednesday's after-hours momentum, the stock will break through the key resistance level of $8.40, further strengthening short-term bullish momentum. This would open up room for a rally toward the October 29 rebound high of $9.39—representing an upside of more than 14% from the latest price—with the next resistance level overhead at $9.65.
On the downside, the primary support zone to watch is the $7.90–$8.00 range. If the stock falls below $7.90, it may continue downward to test its recent low of $7.36, and further down, it could potentially test $7.00.
Nothing in this material constitutes investment advice, personal recommendation, investment research, an offer, or a solicitation to buy or sell any financial instrument. The content has been prepared without consideration of your individual investment objectives, financial situation, or needs, and should not be treated as such.
Past performance is not a reliable indicator of future performance and/or results. Forward-looking scenarios or forecasts are not a guarantee of future performance. Actual results may differ materially from those anticipated.
Mitrade makes no representation or warranty as to the accuracy or completeness of the information provided and accepts no liability for any loss arising from reliance on such information.
Recommended Articles


