



CoreWeave Stock Jumps 16% Overnight on Funding Relief, With $53.23 the Line to Hold
TradingKey - CoreWeave (NASDAQ: CRWV) jumped about 16% in overnight trading to $56.67 after its third-quarter report, having slipped 0.51% to $48.73 in the regular session on Tuesday, November 10. Revenue beat estimates, the company raised its 2026 outlook, and management laid out a funding plan aimed at the market's biggest fear.
The relief follows a slide of more than 40% in the past month on worries about debt-funded AI spending. Before the report, the stock closed about 65% below its 52-week high of $138.25 and only about 20% above its 52-week low of $40.58.
A Beat on Revenue and Margins
Revenue rose 168% to $3.66 billion, above the roughly $3.56 billion consensus from Bloomberg data, and the adjusted loss of $1.27 a share was smaller than the $1.46 to $1.55 that analysts expected. Adjusted operating income, which leaves out items such as stock-based pay, reached $379 million, well above the $200 million to $260 million guide. The adjusted operating margin rose to 10% from 5% in Q2 and 1% in Q1.
Backlog, signed contracts not yet booked as revenue, grew to $132.5 billion from about $104 billion at the end of June. CoreWeave raised its 2026 revenue guide to $13.0 billion to $13.3 billion and lifted its adjusted operating income guide by 26% at the midpoint, to $1.275 billion to $1.375 billion.
The Funding Plan Behind the Rally
On funding, the main worry, CEO Michael Intrator said, "we will not use the unsecured debt market to fund our business at current yields, nor do we need to." Unsecured bonds are not backed by specific assets, so they usually cost a borrower like CoreWeave more. The company expects to raise less than $5 billion of new capital at the parent company through 2027.
Its next delayed-draw term loan, a loan drawn in stages as projects are built, should price at a yield of about 7% to 7.5% and cover more than 90% of the related capex. The company also expects about $9 billion of customer prepayments and deposits over the next three months, and its weighted average cost of debt has fallen 2.5 percentage points from a year ago to 7.9%.
Interest Costs Still Outrun Profit
Interest expense rose to $846 million from $310 million, more than twice adjusted operating income, and the net loss widened to $709 million from $110 million. Q4 interest is guided higher at $1.05 billion to $1.15 billion, and this year's capex of $37 billion to $39 billion is roughly three times revenue. CoreWeave expects adjusted net income to turn positive in the first half of 2028.
The rally came even though interest costs keep rising, which shows the market had been pricing a funding crisis, not just slower growth. Before the report, UBS's Karl Keirstead cut his target to $105 from $120 and called restoring investor confidence a "multi-quarter fix."
In my view, the funding plan buys time, but the rally lasts only if margins keep rising faster than interest costs.
CoreWeave Technical Analysis: Close Above the $57 Trendline Could Open $66.52
On the daily chart, the overnight jump to $56.67 would lift CRWV straight above the $53.23 resistance zone, the old support area that broke in late October, if the gain holds into the session. It would also bring the stock up to the falling trendline from the August high, a line drawn across its lower highs, and the results are clearly driving the move. This is a key test, because CRWV has made lower highs for months.
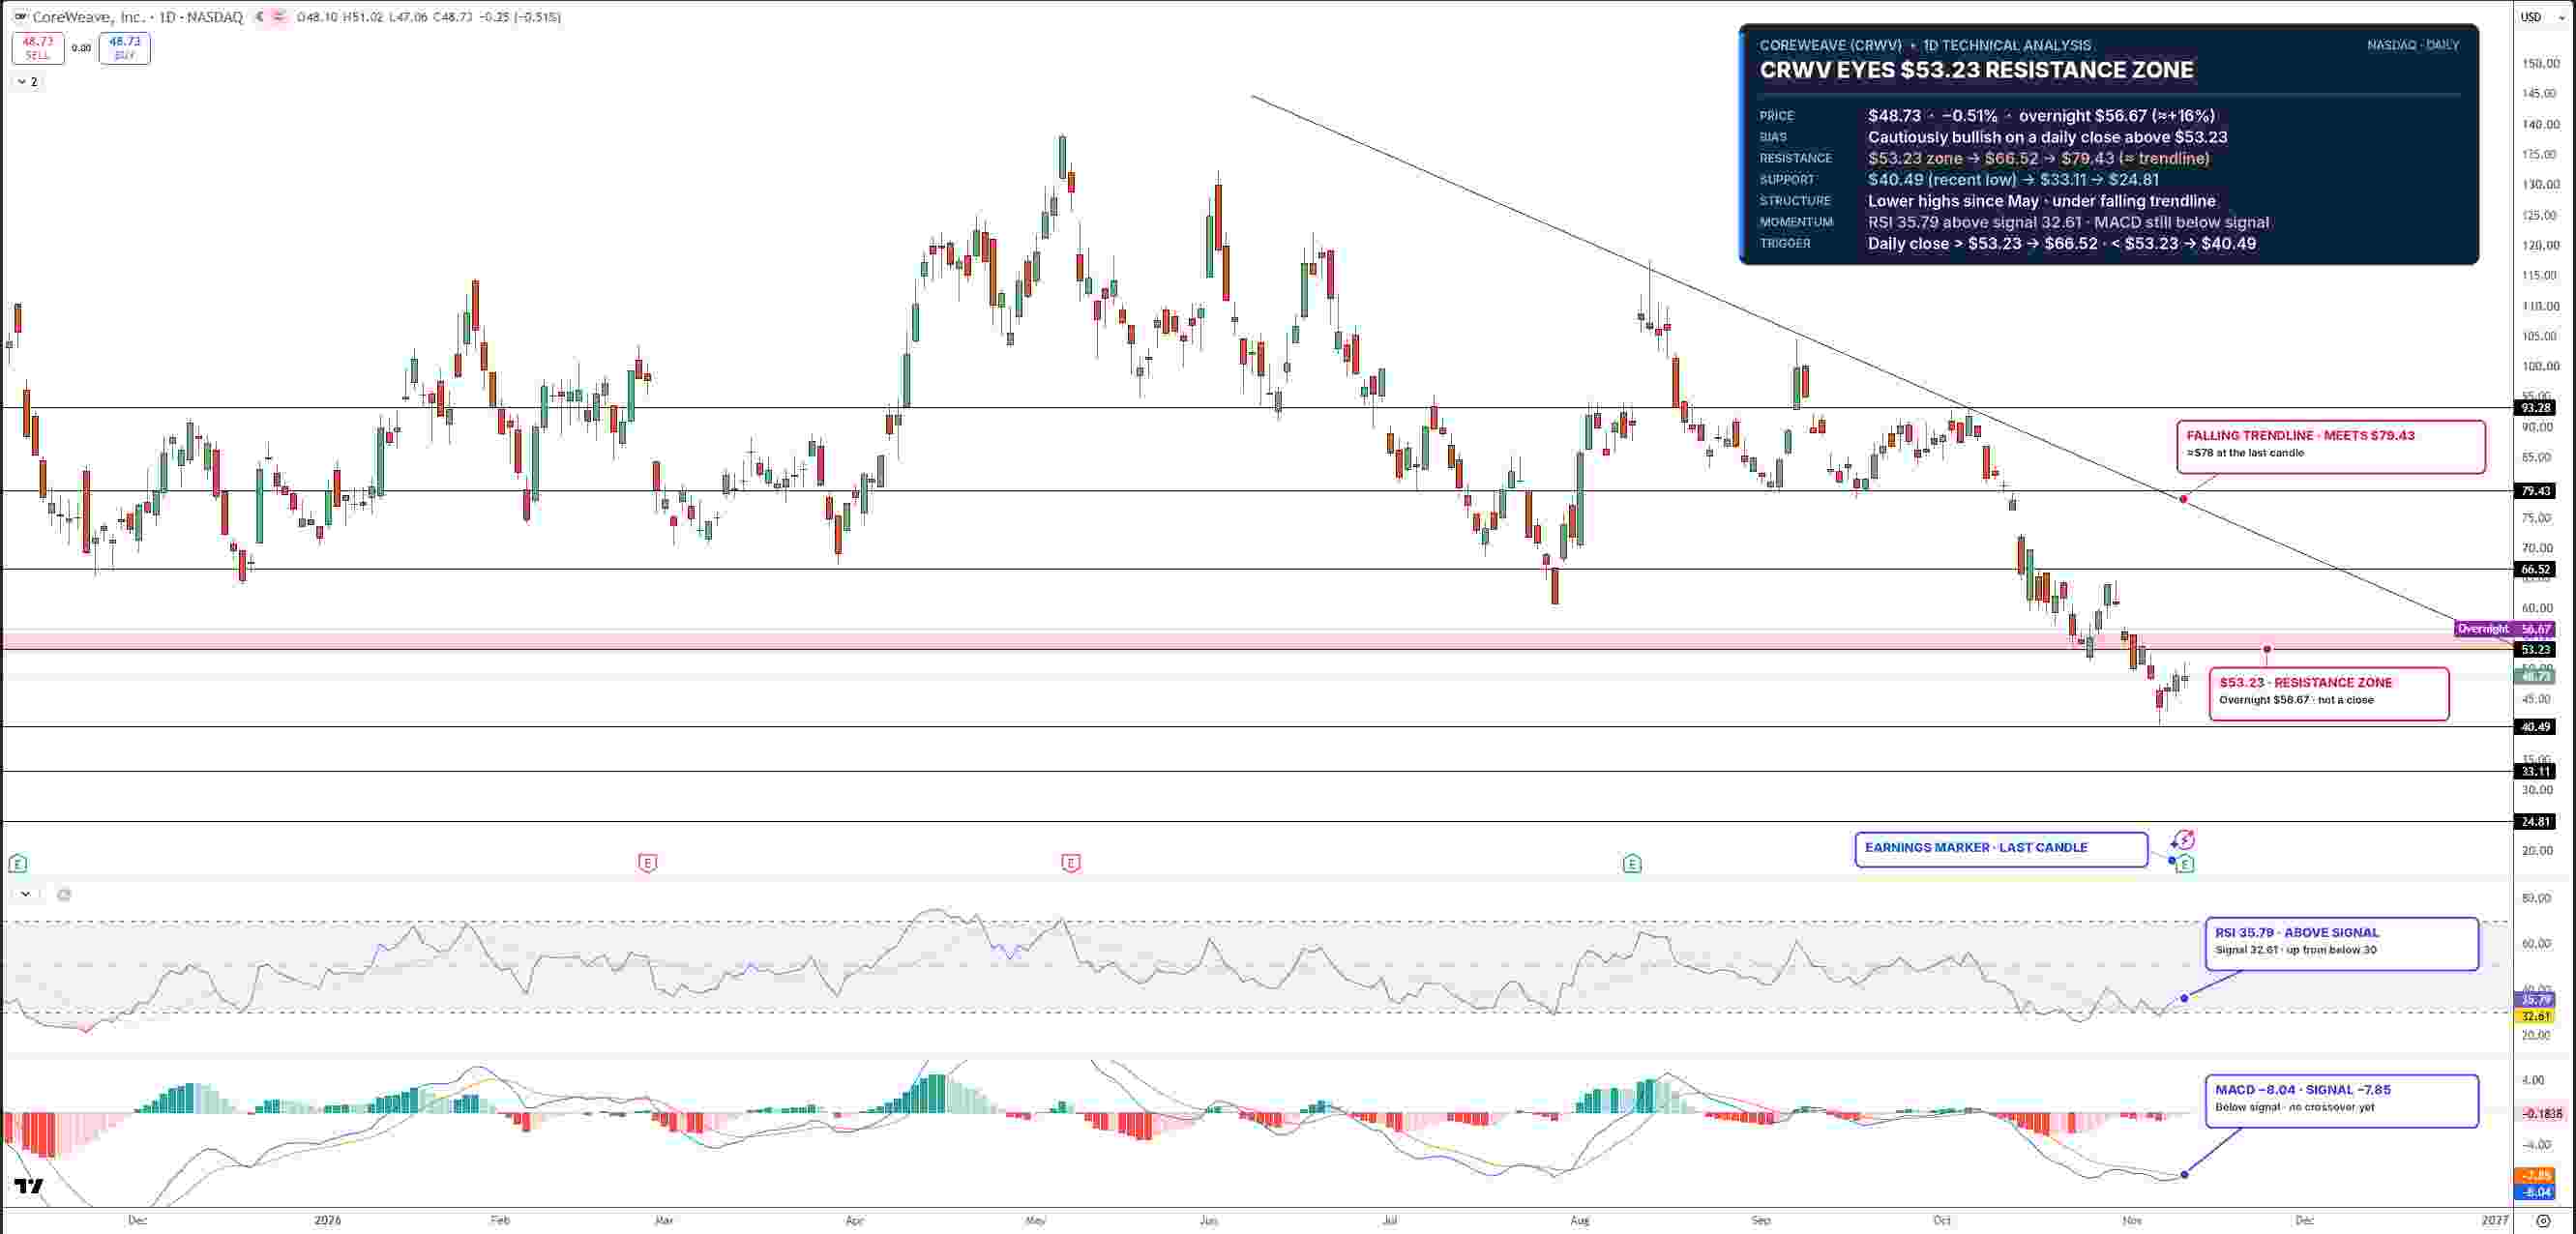
CoreWeave Stock Price Chart - Source: Tradingview
RSI, a momentum gauge that runs from 0 to 100, sits near 36 and is turning higher from near 30, the oversold line. The MACD, a trend-following momentum indicator, is close to a bullish crossover, which hints that selling pressure is fading.
A daily close above the trendline near $57 could open $66.52, then $79.43. If buyers fail to hold the gap, a drop back below $53.23 could send CRWV toward $40.49.
I'm cautiously bullish if CRWV closes above $53.23, with $66.52 as the first target.
Key Levels
- Last close: $48.73, down 0.51% on Tuesday, November 10 (overnight: $56.67)
- Support: $53.23 if the gap holds, then $40.49
- Resistance: about $57 (trendline), $66.52, $79.43
- RSI: 35.79, turning up from near oversold
- Bullish trigger: Daily close above $53.23
- Bearish trigger: Gap fails and CRWV closes back below $53.23
FAQs
Why is CoreWeave stock up after earnings?
CoreWeave jumped about 16% overnight after Q3 revenue of $3.66 billion beat estimates, the company raised its 2026 outlook and it said it will not use the unsecured debt market to fund growth at current yields.
What is the CoreWeave stock forecast now?
The bias is cautiously bullish if CRWV closes above $53.23 on the daily chart. A close above the trendline near $57 could open $66.52 and $79.43, while a drop back below $53.23 could send it toward $40.49.
Bottom Line
CoreWeave answered the funding question for now, but interest costs still run ahead of operating profit. I expect a push toward $66.52 if CRWV closes above $53.23 and clears the trendline near $57, while a slide back below $53.23 would show the relief rally has faded.
Nothing in this material constitutes investment advice, personal recommendation, investment research, an offer, or a solicitation to buy or sell any financial instrument. The content has been prepared without consideration of your individual investment objectives, financial situation, or needs, and should not be treated as such.
Past performance is not a reliable indicator of future performance and/or results. Forward-looking scenarios or forecasts are not a guarantee of future performance. Actual results may differ materially from those anticipated.
Mitrade makes no representation or warranty as to the accuracy or completeness of the information provided and accepts no liability for any loss arising from reliance on such information.
Recommended Articles


