



Rocket Lab Stock Reclaims $55.86 After a Record Q3, With the $68.14 Trendline Next
TradingKey - Rocket Lab (NASDAQ: RKLB) rose 6.6% to $62.74 on Tuesday, November 10, after its third-quarter report, and premarket trading was slightly higher at $63.05. The stock had dipped to $55.60 in early premarket trading after the results, as investors first focused on a wider loss, before buyers took over.
Tuesday's gain followed a 10.91% jump to $58.86 on Monday, before the report, during a broad market rally. Even after both moves, RKLB is still at less than half of its record high above $150 from earlier this year.
Record Revenue, Wider Loss
Revenue rose 73% to a record $267.8 million, above the roughly $256.5 million Zacks consensus. But the adjusted loss of $0.07 a share missed the $0.02 loss analysts expected, and the GAAP net loss, under standard accounting rules, widened to $79.7 million from $18.3 million, including a $9.4 million charge tied to Iridium's term loan. Non-GAAP gross margin, the share of revenue left after production costs, was 38.4%.
Cash flow moved the other way, as operating cash flow turned positive at $7.2 million and free cash use, the cash burned after capital spending, fell to $23.9 million. Rocket Lab ended the quarter with $4.45 billion in cash.
Backlog Jumps 52% Despite the Neutron Delay
Backlog, signed contracts not yet booked as revenue, rose 52% from Q2 to a record of about $3.57 billion. Rocket Lab signed about $1 billion of new launch contracts, including more than $515 million for eight Neutron missions, and raised Neutron's base price to $70 million from $55 million. Space Systems added $470 million of new orders in Q3.
Neutron, Rocket Lab's larger medium-lift rocket, is now set to fly no earlier than 2027 after voids were found in a first-stage propellant tank dome. A replacement dome has been built, and testing continues at Launch Complex 3. CFO Adam Spice said adjusted EBITDA, a measure of operating profit before items such as depreciation and stock-based pay, should turn positive within six months of Neutron's first successful flight.
Customers still signed $515 million of Neutron missions at a higher price for a rocket that has not flown yet, which says more about demand than the delay does.
Q4 Guide and the Iridium Deal
For Q4, Rocket Lab guided revenue to a record $270 million to $290 million, above the roughly $265.8 million analysts expected. Its adjusted EBITDA loss guide of $14 million to $20 million, however, was worse than the roughly $10.9 million loss analysts modeled.
The $54-per-share Iridium deal is fully funded and approved by Iridium's shareholders and lenders. It still needs FCC and foreign approval before closing in 2027, and about half of Neutron's capacity is reserved for Rocket Lab's own services, including replacing Iridium satellites.
In my view, demand is not the problem, but investors will want Neutron to fly before they pay up for the backlog again.
Rocket Lab Technical Analysis: Daily Close Above $68.14 Could Open $75.60
On the daily chart, buyers quickly reversed last week's drop toward $45.96, and RKLB is now back above the $55.86 support zone it lost in October. Monday's 10.91% jump came before the report and Tuesday's gain came after it, so the results added to a rebound that was already under way. The next big test is the falling trendline from the June high, a line drawn across its lower highs, which sits near $68.14.
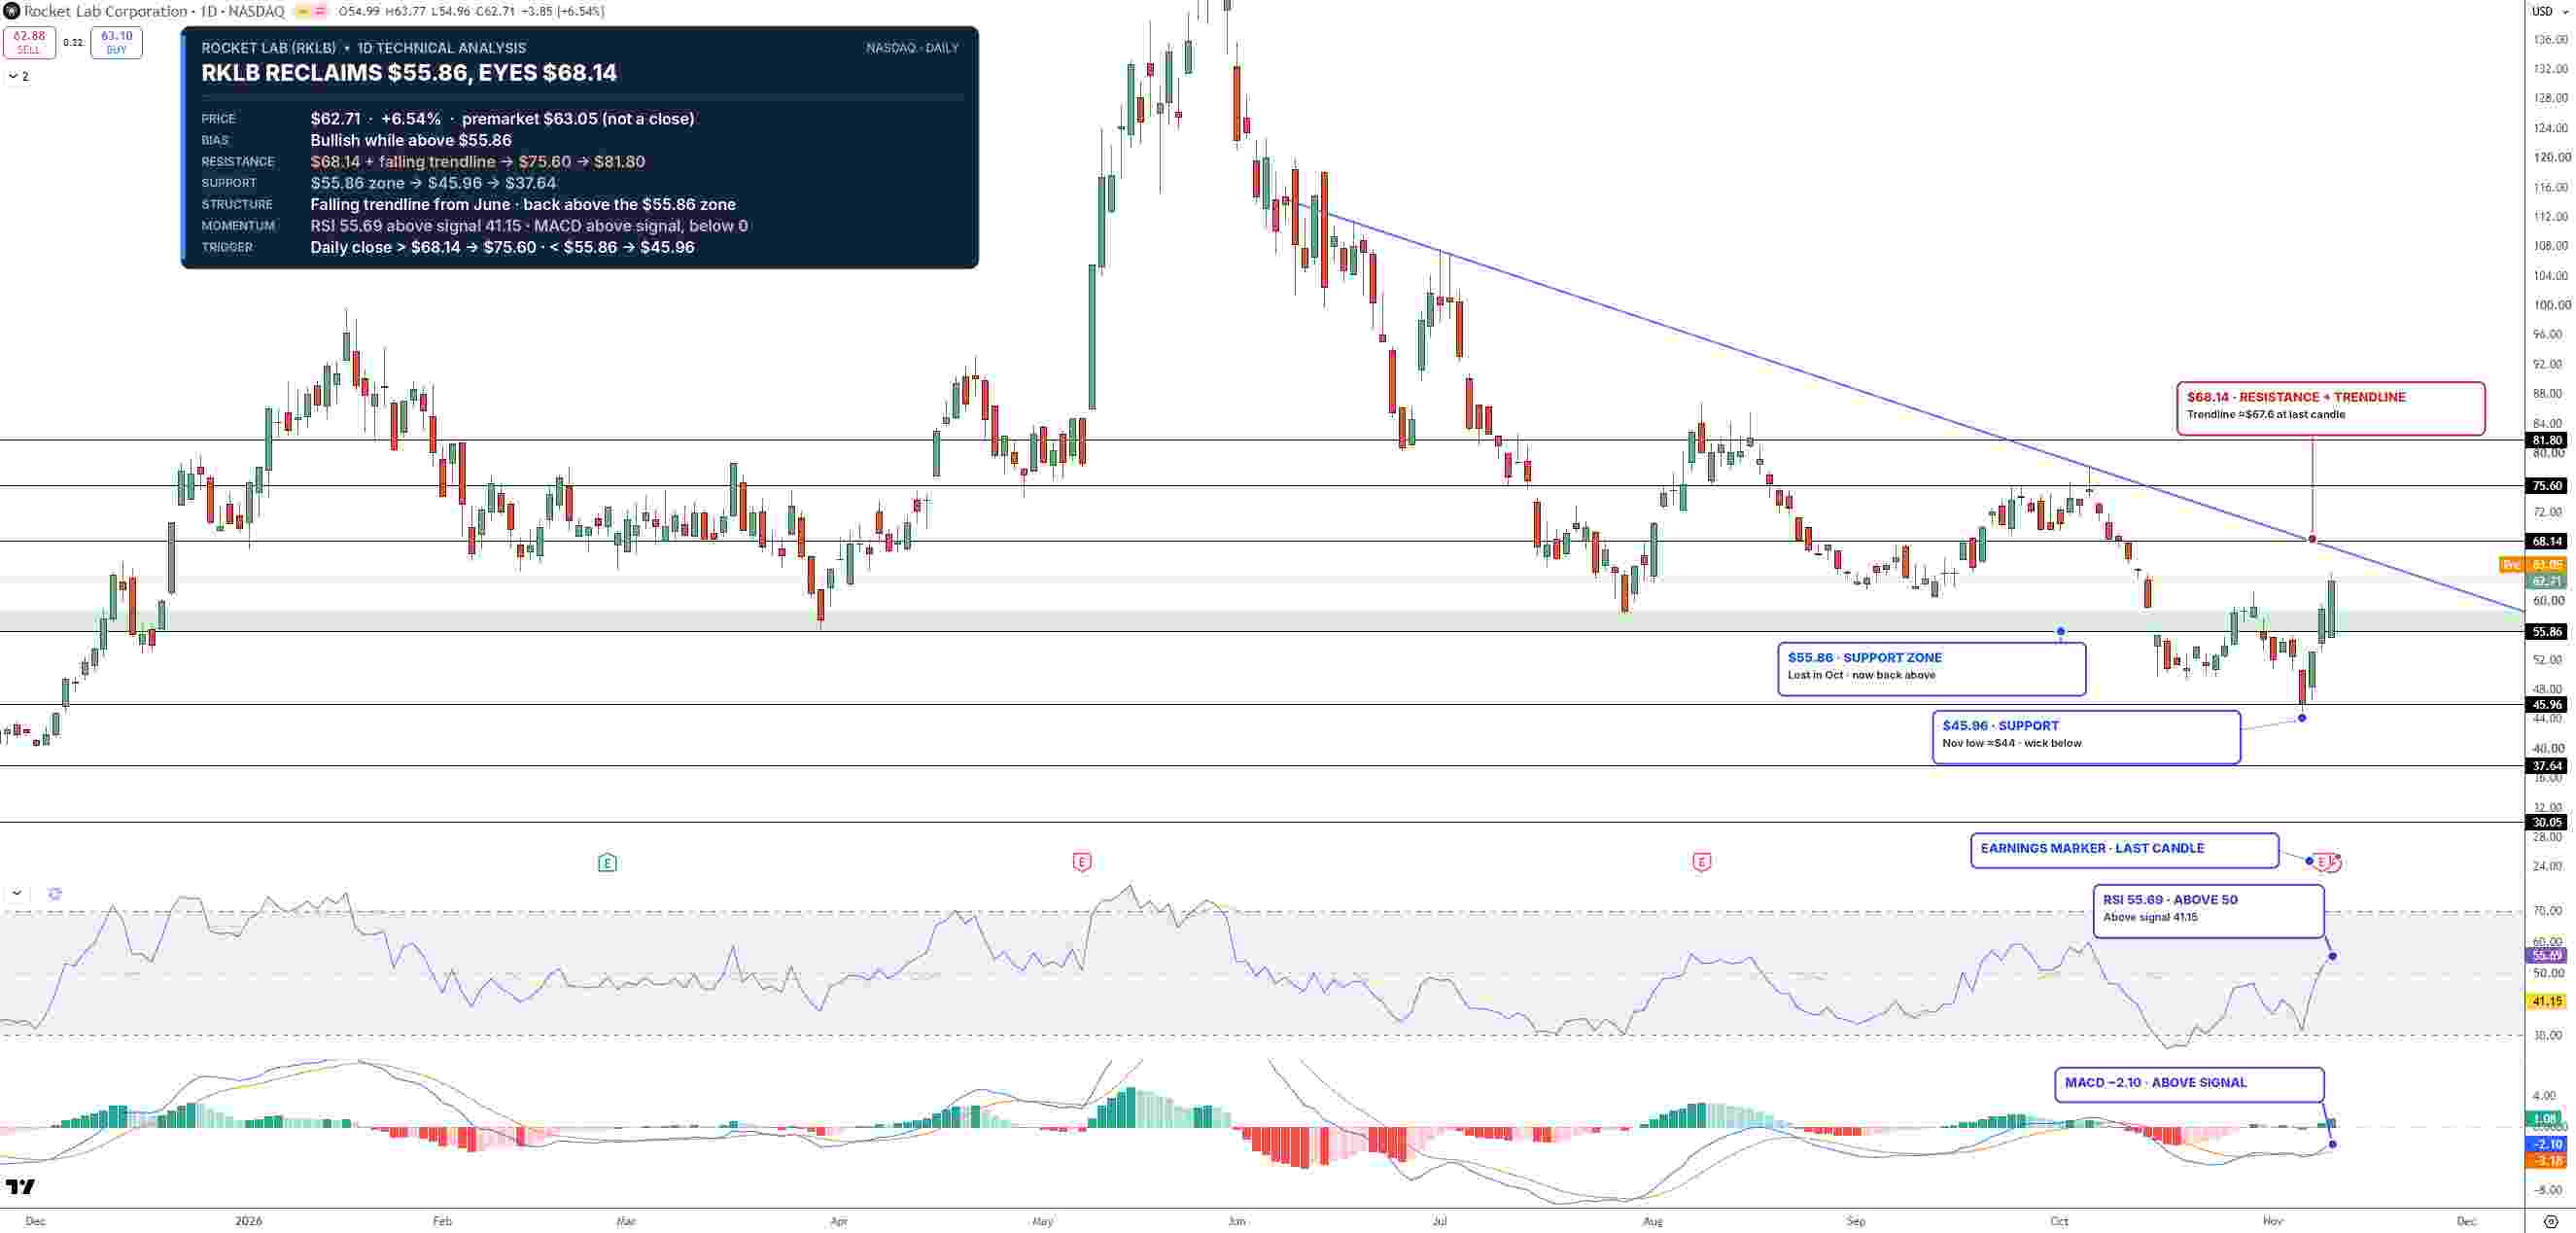
Rocket Lab Stock Price Chart - Source: Tradingview
RSI, a momentum gauge that runs from 0 to 100, has climbed to about 56, above the neutral 50 line. The MACD, a trend-following momentum indicator, has turned positive with a bullish crossover, a sign that momentum is shifting toward buyers.
A daily close above $68.14 would break the downtrend and could open $75.60, then $81.80. On the downside, a drop back below $55.86 could send RKLB toward $45.96.
I'm bullish while RKLB holds above $55.86, with $68.14 as the key breakout level.
Key Levels
- Last close: $62.74, up 6.6% on Tuesday, November 10 (premarket: $63.05)
- Support: $55.86, $45.96
- Resistance: $68.14, $75.60, $81.80
- RSI: 55.69, above the 50 midline
- Bullish trigger: Daily close above $68.14
- Bearish trigger: Daily close below $55.86
FAQs
Why did Rocket Lab stock rise after earnings?
Rocket Lab rose 6.6% on Tuesday after record Q3 revenue of $267.8 million and a 52% jump in backlog to about $3.57 billion, including more than $515 million of new Neutron contracts, outweighed a wider-than-expected loss.
What is the Rocket Lab stock forecast now?
The bias is bullish while RKLB holds above $55.86 on the daily chart. A daily close above $68.14 could open $75.60 and $81.80, while a drop below $55.86 could send it toward $45.96.
Bottom Line
Rocket Lab's demand is growing faster than its rocket schedule, and the stock is rebuilding from last week's lows. I expect a test of the $68.14 trendline while RKLB holds $55.86, and a close back below that support would put the $45.96 area back in play.
Nothing in this material constitutes investment advice, personal recommendation, investment research, an offer, or a solicitation to buy or sell any financial instrument. The content has been prepared without consideration of your individual investment objectives, financial situation, or needs, and should not be treated as such.
Past performance is not a reliable indicator of future performance and/or results. Forward-looking scenarios or forecasts are not a guarantee of future performance. Actual results may differ materially from those anticipated.
Mitrade makes no representation or warranty as to the accuracy or completeness of the information provided and accepts no liability for any loss arising from reliance on such information.
Recommended Articles


