



Oracle Stock Price Forecast: Bernstein Says Market Undervalues Data Center and Core Database Businesses, Sees Shares Rebounding to $132
TradingKey - On November 11, Eastern Time, Oracle (ORCL) shares rose 10%, reclaiming the $130 mark. Recently, uncertainties surrounding returns on AI investments and the competitive landscape of the software industry have continued to weigh on Oracle's stock price. However, Bernstein believes the market has underestimated the value of its AI data centers and core database business, assigning an Outperform rating and a $325 price target.
Investors are most concerned about whether massive data center investments can generate sufficient profits and how much longer the company will need to continue raising capital. Bernstein pointed out that Oracle's disclosed business economics exceeded the firm's prior expectations. According to management, the AI data center business is expected to generate an operating margin of approximately 34%. Although its gross margin is lower than that of traditional businesses, it still boasts substantial profit potential.
Improving cash flow is an important condition supporting a valuation recovery. Bernstein believes Oracle could return to positive free cash flow as early as the second half of fiscal 2028. The firm expects capital expenditures to begin declining after fiscal 2028, with fiscal 2029 free cash flow reaching approximately $28 billion, close to the company's target of around $30 billion.
This means that as the peak of construction passes and operational capacity contributes revenue, Oracle is poised to reduce its reliance on external financing. The funding gap and ongoing financing pressures previously priced into the stock are also expected to ease as cash flow improves.
Customer payment capacity is another point of contention. Bernstein noted that the $300 billion in contract value committed by OpenAI accounts for less than 48% of Oracle's remaining performance obligations, with its share of annual revenue even lower. The firm cited a potential OpenAI IPO as a catalyst, arguing that public listing disclosures and financing would help investors assess its ability to pay for computing power, easing doubts about the fulfillment of Oracle's orders.
Bernstein has raised its fiscal 2030 revenue forecast for Oracle from $211 billion to $234 billion and expects operating income for the period to reach $80 billion. The firm's core rationale for a stock rebound is that orders will gradually convert into revenue while construction spending declines, jointly driving improvements in profitability and cash flow. Over the coming quarters, the realization of these metrics will influence the market's reassessment of Oracle's valuation.
From a technical perspective, following its gap-up rally, Oracle reclaimed its 20-day exponential moving average ($127.24) intraday, with short-term recovery momentum strengthening noticeably. However, the overhead resistance zone of $132.43–$132.70, formed by the 80-day exponential moving average and the 0.382 Fibonacci retracement level, has yet to be broken, leaving the stock still in a rebound phase following its decline.
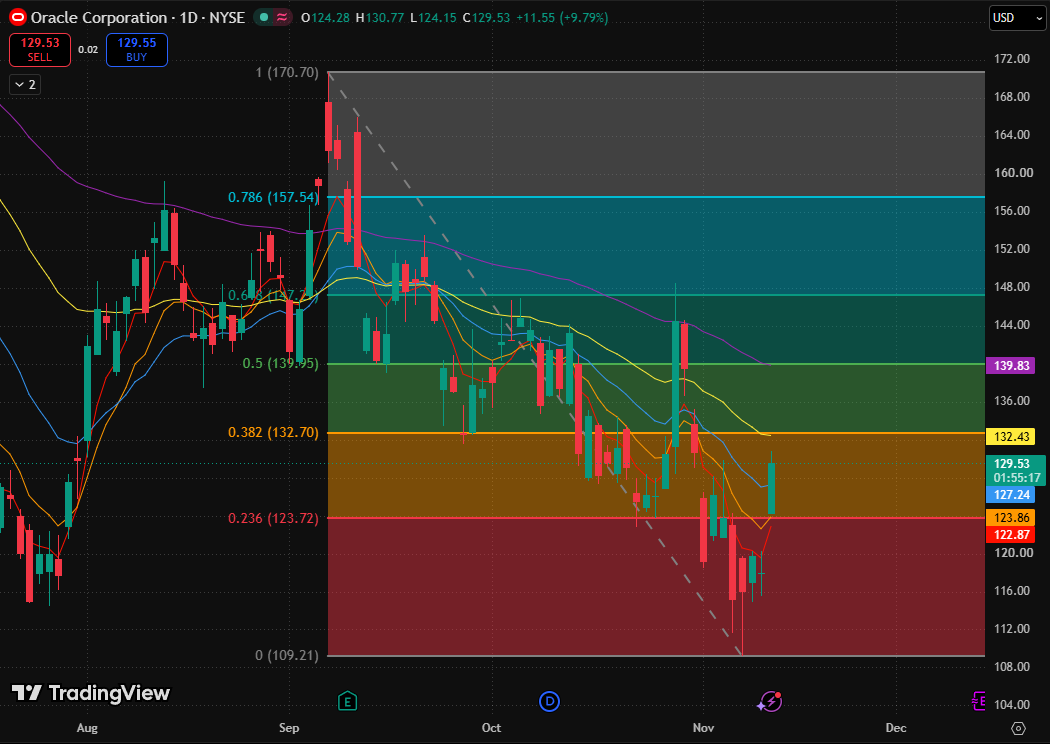
Oracle stock chart, Source: TradingView
In terms of trend and structure, following recent consecutive gains, the current candlestick gapped up and continued higher, with prices re-entering a range that saw repeated trading in late October. This indicates that the recovery has progressed, though it has not yet reversed the broader backdrop of declining medium-term highs. Regarding moving averages, the five moving averages remain in a bearish alignment overall. What has improved currently is price level and short-term direction, while the moving average structure has yet to turn bullish.
The nearest structural resistance overhead is the $132.43–$132.70 zone formed by the 80-day exponential moving average and the 0.382 Fibonacci retracement level. If the stock successfully climbs above this price range, it will further challenge the $139.83–$139.95 zone formed by the 160-day exponential moving average and the 0.5 Fibonacci retracement level.
If the stock decisively breaks below the dense support band of $122.87–$124.15 and fails to reclaim it on a rebound, the recovery gains from this gap-up rally will be significantly impaired. Gap-fill pressure would increase, warranting renewed observation of buying support around previous lows.
Nothing in this material constitutes investment advice, personal recommendation, investment research, an offer, or a solicitation to buy or sell any financial instrument. The content has been prepared without consideration of your individual investment objectives, financial situation, or needs, and should not be treated as such.
Past performance is not a reliable indicator of future performance and/or results. Forward-looking scenarios or forecasts are not a guarantee of future performance. Actual results may differ materially from those anticipated.
Mitrade makes no representation or warranty as to the accuracy or completeness of the information provided and accepts no liability for any loss arising from reliance on such information.
Recommended Articles


