


CFDs are complex instruments and come with a high risk of losing money rapidly due to leverage. 83% of retail investor accounts lose money when trading CFDs with this provider. You should consider whether you understand how CFDs work and whether you can afford to take the high risk of losing your money.

Pi Network Price Forecast: PI rebound loses steam ahead of critical resistance trendline

Source Fxstreet
  • Pi Network hovers around $0.0700 on Thursday, consolidating after Tuesday’s 8% rebound.
  • Over 590 million PI have flown from OKX’s exchange wallet to the GASW wallet this week, reducing available selling pressure.
  • The technical outlook for PI remains bearish, as the price is capped below a long-term descending trendline near $0.0730.

Pi Network (PI) price is holding steady around $0.0700 at press time on Thursday, consolidating around the round figure after Tuesday’s 8% rebound. The rebound coincided with a massive outflow of more than 590 million PI tokens from the OKX exchange wallet, suggesting reduced downside pressure. Technically, the PI remains capped below a key trendline around $0.0730, maintaining a bearish bias.

OKX exchange PI wallet drain

The OKX exchange wallet holding PI saw a massive withdrawal of 593 million tokens on Tuesday, reducing the amount of supply available for sale. This outflow increases the Pi concentration among non-selling holders, projecting long-term upside potential.
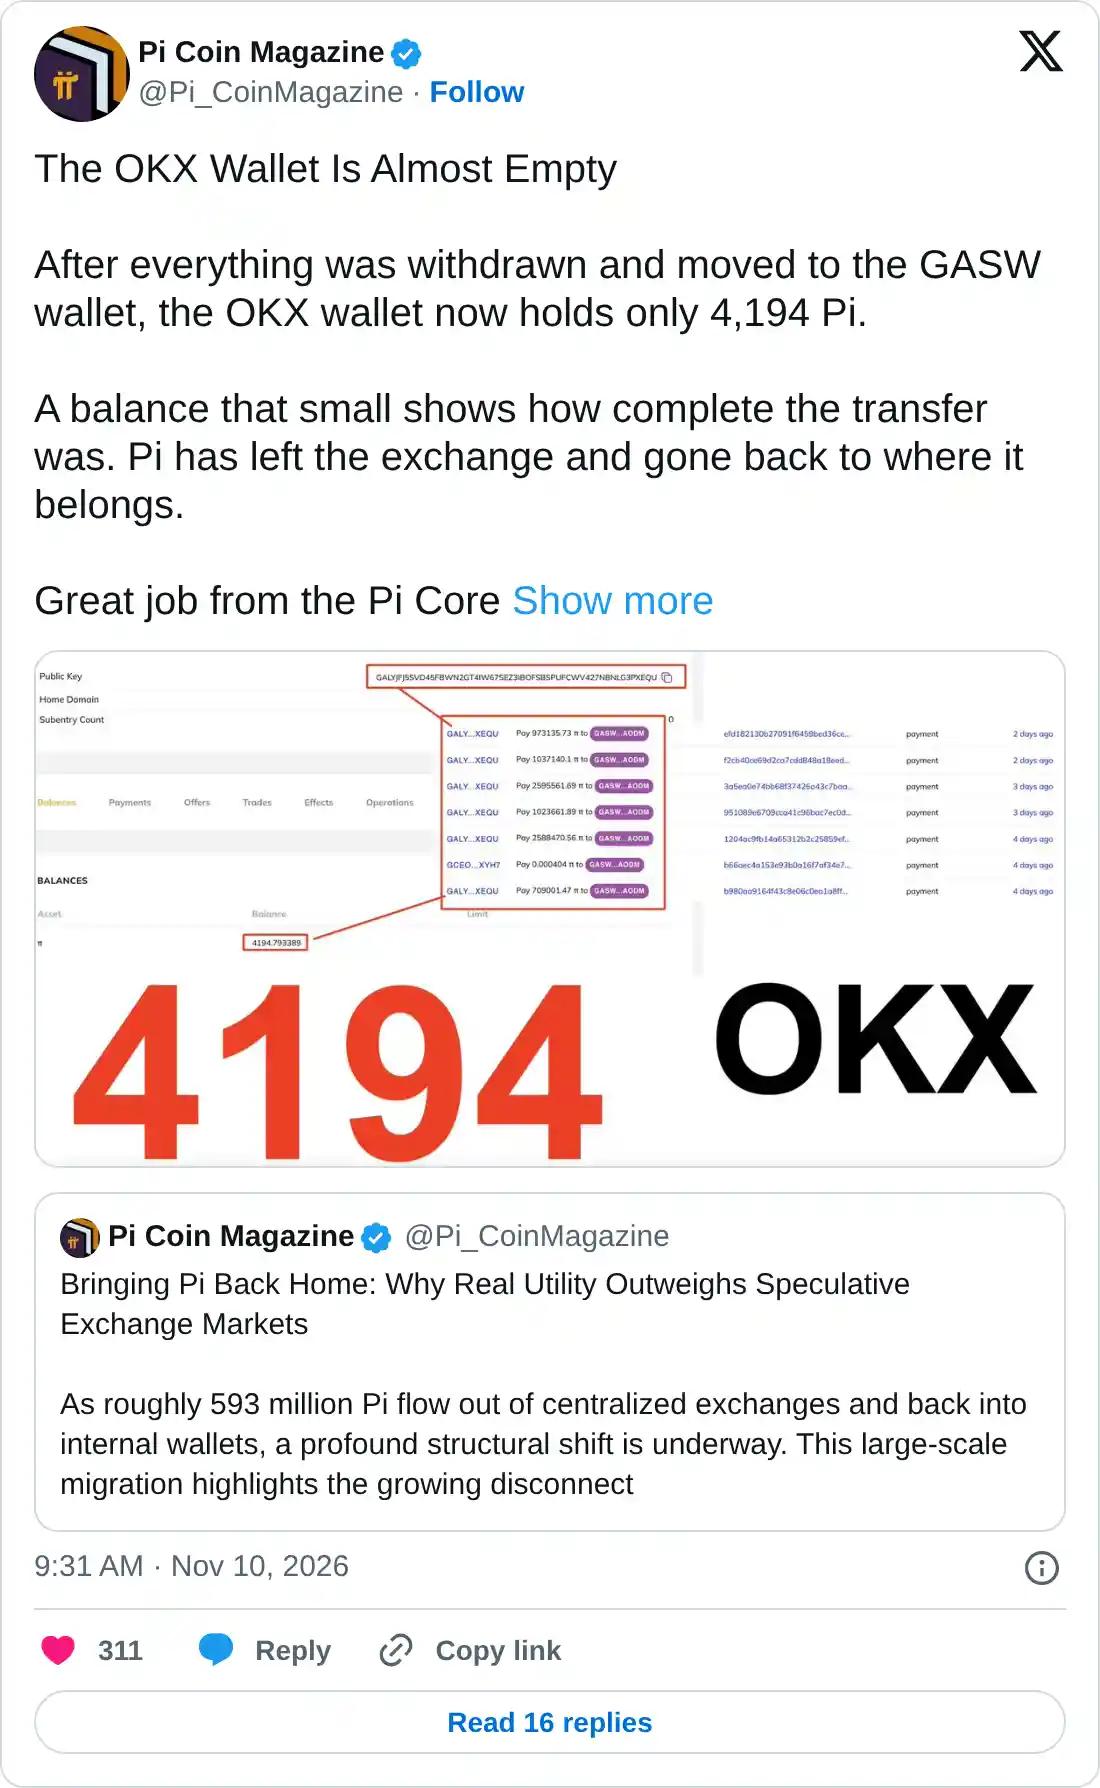
https://x.com/Pi_CoinMagazine/status/2120087046911860883

Technical outlook: Will PI extend gains for a breakout rally?

Pi Network trades at $0.0702 at press time on Thursday, extending its bearish tone below a capped resistance around $0.0730. The PI token is also trading below both the 50-day Exponential Moving Average (EMA) at $0.0792 and the 200-day EMA at $0.1097.

Momentum remains soft on the daily chart, with the Relative Strength Index (RSI) hovering around 36 and the Moving Average Convergence Divergence (MACD) below zero, suggesting lingering downside pressure.

On the topside, the immediate resistance aligns with a rising trendline around $0.0730, reinforced by the 50-day EMA at $0.0792. Further up, medium-term resistance is layered at the 50% retracement of the downswing from $0.1394 to $0.0704, at $0.1049, and at the 200-day EMA at $0.1097.

Chart Analysis PI/USD (baha Crypto)
PI/USD daily price chart.

Looking down, if PI extends below the descending trendline, the 127.2% Fibonacci extension level at $0.0516 could serve as a base for buyers to step in.

(The technical analysis of this story was written with the help of an AI tool. Know more.)

Disclaimer: The content available on Mitrade Insights is provided for informational and marketing purposes only. It has not been prepared in accordance with legal requirements designed to promote the independence of investment research and is not subject to any prohibition on dealing ahead of the dissemination of investment research
Nothing in this material constitutes investment advice, personal recommendation, investment research, an offer, or a solicitation to buy or sell any financial instrument. The content has been prepared without consideration of your individual investment objectives, financial situation, or needs, and should not be treated as such.
Past performance is not a reliable indicator of future performance and/or results. Forward-looking scenarios or forecasts are not a guarantee of future performance. Actual results may differ materially from those anticipated.
Mitrade makes no representation or warranty as to the accuracy or completeness of the information provided and accepts no liability for any loss arising from reliance on such information.
placeholder
Zcash Price Forecast: ZEC bears eye levels below $300 as bearish momentum buildsZcash (ZEC) price is trading below $365 on Tuesday, after closing below the key support zone the previous day. The bearish narrative for ZEC strengthens as metrics show sell-side dominance rising and funding rates turning negative.
Author  FXStreet
Jan 20, Tue
Zcash (ZEC) price is trading below $365 on Tuesday, after closing below the key support zone the previous day. The bearish narrative for ZEC strengthens as metrics show sell-side dominance rising and funding rates turning negative.
placeholder
Japan's Nikkei closes at record high as tech earnings overshadow Mideast concernsBy Rocky Swift TOKYO, April 24 (Reuters) - Japan's Nikkei set a closing record high on Friday, capping a third consecutive weekly gain, as enthusiasm over technology sector earnings offset uncertainty over a potential peace deal in the Middle East.The benchmark Nikkei 225 Index .N225 rose 0.9...
Author  Reuters
Apr 24, Fri
By Rocky Swift TOKYO, April 24 (Reuters) - Japan's Nikkei set a closing record high on Friday, capping a third consecutive weekly gain, as enthusiasm over technology sector earnings offset uncertainty over a potential peace deal in the Middle East.The benchmark Nikkei 225 Index .N225 rose 0.9...
placeholder
The Trumponomics Ebook: Oil Price Volatility in the Iran War Understand how the Strait of Hormuz shock moved markets, and what CFD traders watched next.
Author  Rachel Weiss
Oct 21, Wed
Understand how the Strait of Hormuz shock moved markets, and what CFD traders watched next.
placeholder
BTC holds recent gains above 50-day EMA amid improving momentumBitcoin (BTC) slides slightly but holds most of the recent gains, reclaiming the 50-day Exponential Moving Average (EMA) at $64,300 at the time of writing on Tuesday after rising 2.5% the previous day.
Author  FXStreet
Aug 18, Tue
Bitcoin (BTC) slides slightly but holds most of the recent gains, reclaiming the 50-day Exponential Moving Average (EMA) at $64,300 at the time of writing on Tuesday after rising 2.5% the previous day.
placeholder
WTI Price Forecast: Climbs above $86.00 as 100-day SMA breakout comes into playWest Texas Intermediate (WTI) – the benchmark US Crude Oil price – attracts buyers for the second straight day on Tuesday as escalating US-Iran tensions and the standoff over the Strait of Hormuz continue to fuel supply concerns.
Author  FXStreet
Sep 01, Tue
West Texas Intermediate (WTI) – the benchmark US Crude Oil price – attracts buyers for the second straight day on Tuesday as escalating US-Iran tensions and the standoff over the Strait of Hormuz continue to fuel supply concerns.
goTop
quote