



Micron Rejected at $817.65 as Overnight Trade Slips Toward $777.89 Support
TradingKey - Micron Technology (NASDAQ: MU) rose 11.89% to $811.30 on Wednesday, November 11, as CoreWeave's results revived the AI trade and memory stocks led the rally. Sandisk gained about 13.7% on the same day. Overnight quotes have since slipped to $783.00, just above the first support on the chart.
The rebound followed a sharp drop last week, when Micron fell 17.46% to $656.39 on November 5 in a broad chip selloff. Wednesday's jump took the stock back above its November 4 close of $795.23, but it remains well below the late-October high.
Record Profits at a Low Multiple
In its record fiscal fourth quarter, Micron's revenue reached $54.23 billion, up from $11.32 billion a year earlier and $41.46 billion in the prior quarter. Non-GAAP gross margin, the share of revenue left after production costs excluding certain items, was 87.0%, and non-GAAP EPS was $33.42. Adjusted free cash flow, the cash left after operating costs and capital spending, was $33.20 billion.
For the fiscal first quarter ending in early December, Micron guided revenue to $61.5 billion, plus or minus $1.5 billion, and non-GAAP EPS to $38.15, plus or minus $1.00. By my calculation, the stock trades at about 5.3 times that EPS guide annualized, a very low multiple for a business still growing this fast. That low multiple suggests the market sees these profits as close to the peak of the memory cycle, which is why a record quarter has not kept the stock near its highs.
Goldman Calls It Too Cheap to Ignore
On November 10, Goldman Sachs analyst James Schneider kept a Neutral rating but reiterated a $1,250 target, saying risk/reward is becoming more attractive "in light of the high probability of strong free cash flow in the coming quarters." He also noted that the share price is approaching tangible book value, meaning the market values Micron close to the worth of its physical and financial assets, and the stock trades at about 4.2 times forward earnings.
Bank of America was less upbeat, removing Micron from its list of top stock picks, though it kept a Buy rating.
A $1 Billion Bet on Anthropic
Micron also committed $1 billion to a $26 billion private placement tied to Anthropic's planned stock market listing, according to Anthropic's updated prospectus as summarized by BigGo Finance. Nvidia and Alphabet are putting in $10 billion each. Anthropic is expected to start trading on November 19, two days after Nvidia's results on November 17, so next week will test the AI trade that lifted Micron on Wednesday.
Micron Technical Analysis: 2-Hour Close Above $817.65 Could Open $857.41
That recovery shows clearly on the 2-hour chart. Micron rebounded strongly from $647.24 last week and climbed all the way to $817.65. That level lines up with the 50% Fibonacci retracement, the halfway point of the drop from the late-October high to last week's low, and with the falling trendline from that high, a line drawn across its lower highs. Sellers stepped in right there, so this zone is the key barrier.
RSI, a momentum gauge that runs from 0 to 100, sits near 59. The MACD, another momentum indicator, has turned positive, which shows buyers still have some momentum.
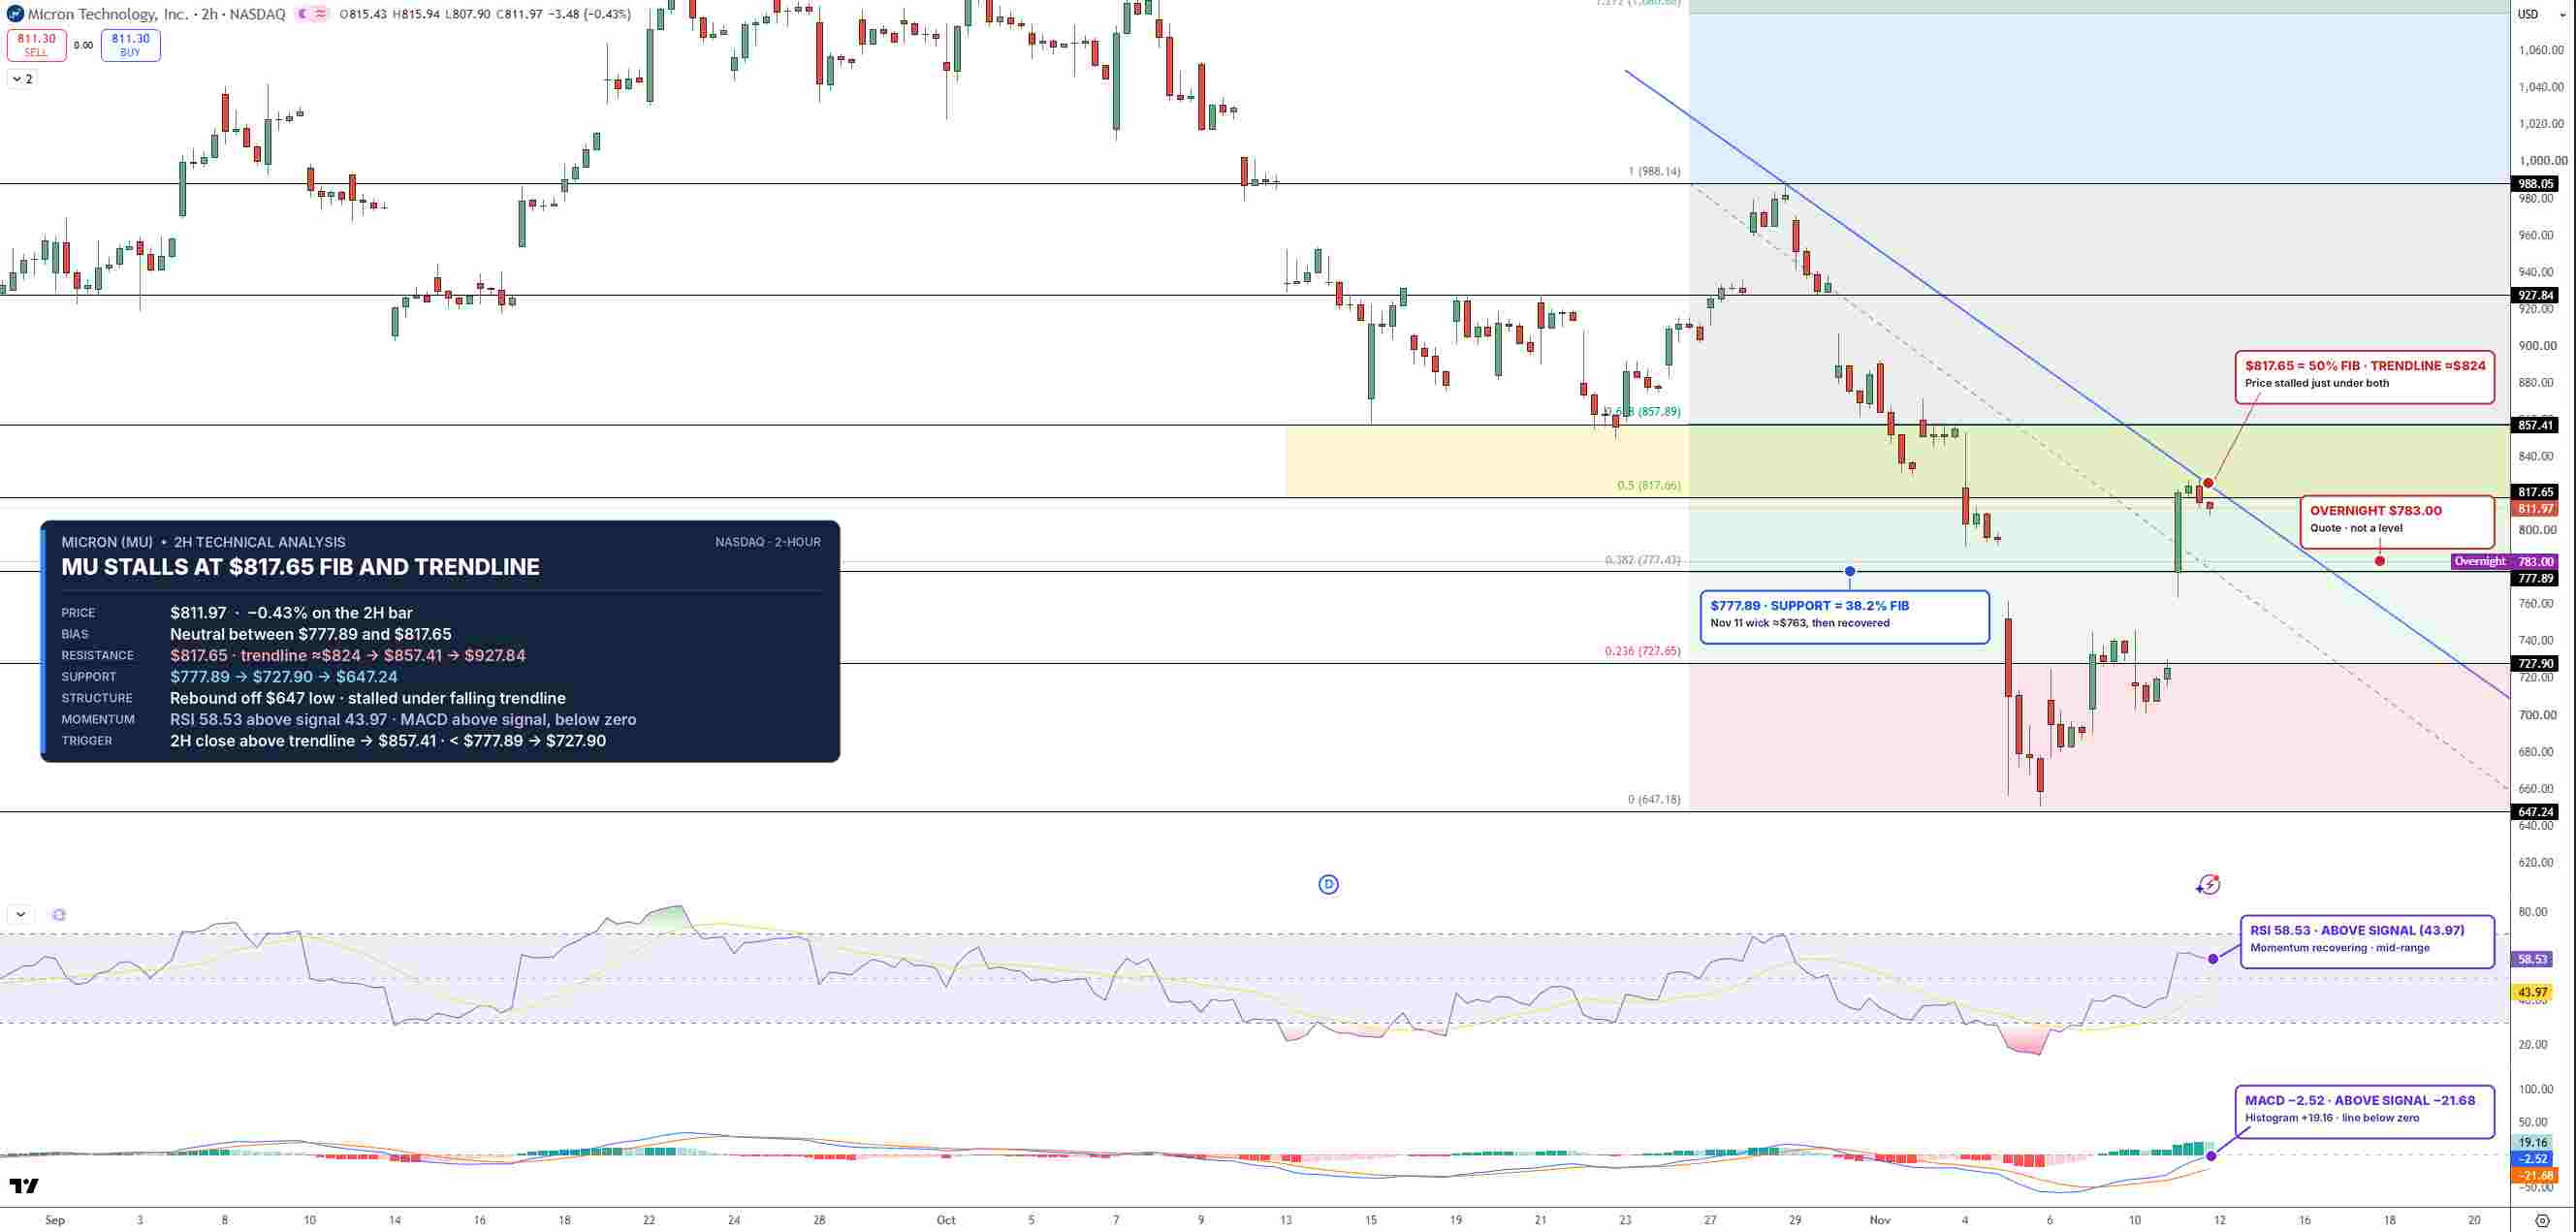
MU Price Chart - Source: Tradingview
A 2-hour close above $817.65 would break the trendline and could open $857.41, followed by $927.84. On the downside, $777.89, near the 38.2% Fibonacci level, is the first support, and the overnight price is already testing that area. A break below it could send MU toward $727.90.
I'm neutral while MU trades between $777.89 and $817.65, and a breakout above $817.65 would turn the outlook bullish.
Key Levels
- Last close: $811.30, up 11.89% on Wednesday, November 11 (overnight: $783.00)
- Support: $777.89, $727.90
- Resistance: $817.65, $857.41, $927.84
- RSI: 58.53
- Bullish trigger: 2-hour close above $817.65
- Bearish trigger: 2-hour close below $777.89
FAQs
Why did Micron stock jump on November 11?
Micron rose 11.89% as CoreWeave's results revived the AI trade and lifted memory stocks, a day after Goldman Sachs said its risk/reward was becoming more attractive. The stock had fallen 17.46% on November 5.
What is the Micron stock forecast now?
The bias is neutral between $777.89 and $817.65 on the 2-hour chart. A 2-hour close above $817.65 targets $857.41 and $927.84, while a break below $777.89 opens $727.90.
Bottom Line
Micron's profits are at a record, but the stock's low multiple shows the market treating them as a peak, and the rebound has stalled where the trendline and the 50% Fibonacci level meet. The level that matters is $817.65. In my view, a 2-hour close above it would open $857.41, while a break below $777.89 would put $727.90 back in play.
Nothing in this material constitutes investment advice, personal recommendation, investment research, an offer, or a solicitation to buy or sell any financial instrument. The content has been prepared without consideration of your individual investment objectives, financial situation, or needs, and should not be treated as such.
Past performance is not a reliable indicator of future performance and/or results. Forward-looking scenarios or forecasts are not a guarantee of future performance. Actual results may differ materially from those anticipated.
Mitrade makes no representation or warranty as to the accuracy or completeness of the information provided and accepts no liability for any loss arising from reliance on such information.
Recommended Articles


