



Dell Gives Back Part of Its 12% Jump as Premarket Tests $362.04 Support
TradingKey - Dell Technologies (NYSE: DELL) jumped 11.75% to $373.68 on Wednesday, November 11, as CoreWeave's results revived bets on AI server demand. Super Micro and Hewlett Packard Enterprise also rallied. Premarket trading has cooled to $361.00, giving back part of that gain.
That bounce followed a steep slide. According to Trefis, Dell lost 45.2% between its October 7 peak and November 5, when the stock traded at about 18 times trailing earnings. Dell reports fiscal third-quarter results on Tuesday, November 24.
A $95 Billion Backlog
In fiscal Q2, which Dell reported on September 1, revenue rose 58% to a record $46.97 billion, and non-GAAP EPS, which excludes items such as stock-based pay, rose to $7.04 against about $4.97 expected. AI server revenue reached $16.4 billion, and AI orders jumped to $60.9 billion from $24.4 billion in the first quarter. That lifted the AI server backlog, orders not yet delivered, to a record $95 billion from $51.3 billion.
The Infrastructure Solutions Group, which sells servers, storage and networking, lifted operating income to $4.78 billion, a 15.0% margin up from 8.8%, and overall gross margin rose to 20.9% from 18.3%.
Guidance Points Much Higher
Dell raised its fiscal 2027 revenue forecast to $192 billion from $167 billion and its AI server revenue forecast to $74 billion from $60 billion. It expects non-GAAP EPS of $25.50, up from $17.90. For the third quarter, it guided revenue to $49.0 billion, up 81%, and non-GAAP EPS to $6.50.
Those numbers did not stop the October slide. Investors are less worried about demand than about whether Dell can turn that backlog into profit and cash.
Cash Flow Is the Weak Spot
Free cash flow, the cash left after operating costs and capital spending, was only $986 million in the second quarter, even with record revenue. Dell's adjusted figure of $8.15 billion adds back $6.67 billion of financing receivables, money it lent customers to buy its products. Dell also closed a $5 billion senior notes offering on September 15, with the proceeds earmarked for general corporate purposes, which may include repaying debt. Management has tied recent price increases to rising memory and component costs, which also puts margins at risk.
Dell Technical Analysis: Daily Close Above $389.15 Could Open $412.61
That gap between strong orders and weak cash shows clearly on the daily chart. Wednesday's rally lifted the stock off the $315.70 low and back above $362.04, the 23.6% Fibonacci retracement, the first of the common Fibonacci levels that traders use to measure a bounce within a decline. Sellers stepped in near $384.69, just below $389.15 resistance, though. DELL is also still trading inside a falling channel, two parallel lines that have guided prices lower since September, so the bigger trend remains bearish.
RSI, a momentum gauge that runs from 0 to 100, has climbed to about 40 from near-oversold levels. The MACD, another momentum indicator, is still negative, but its bars are shrinking, which shows selling pressure is easing.
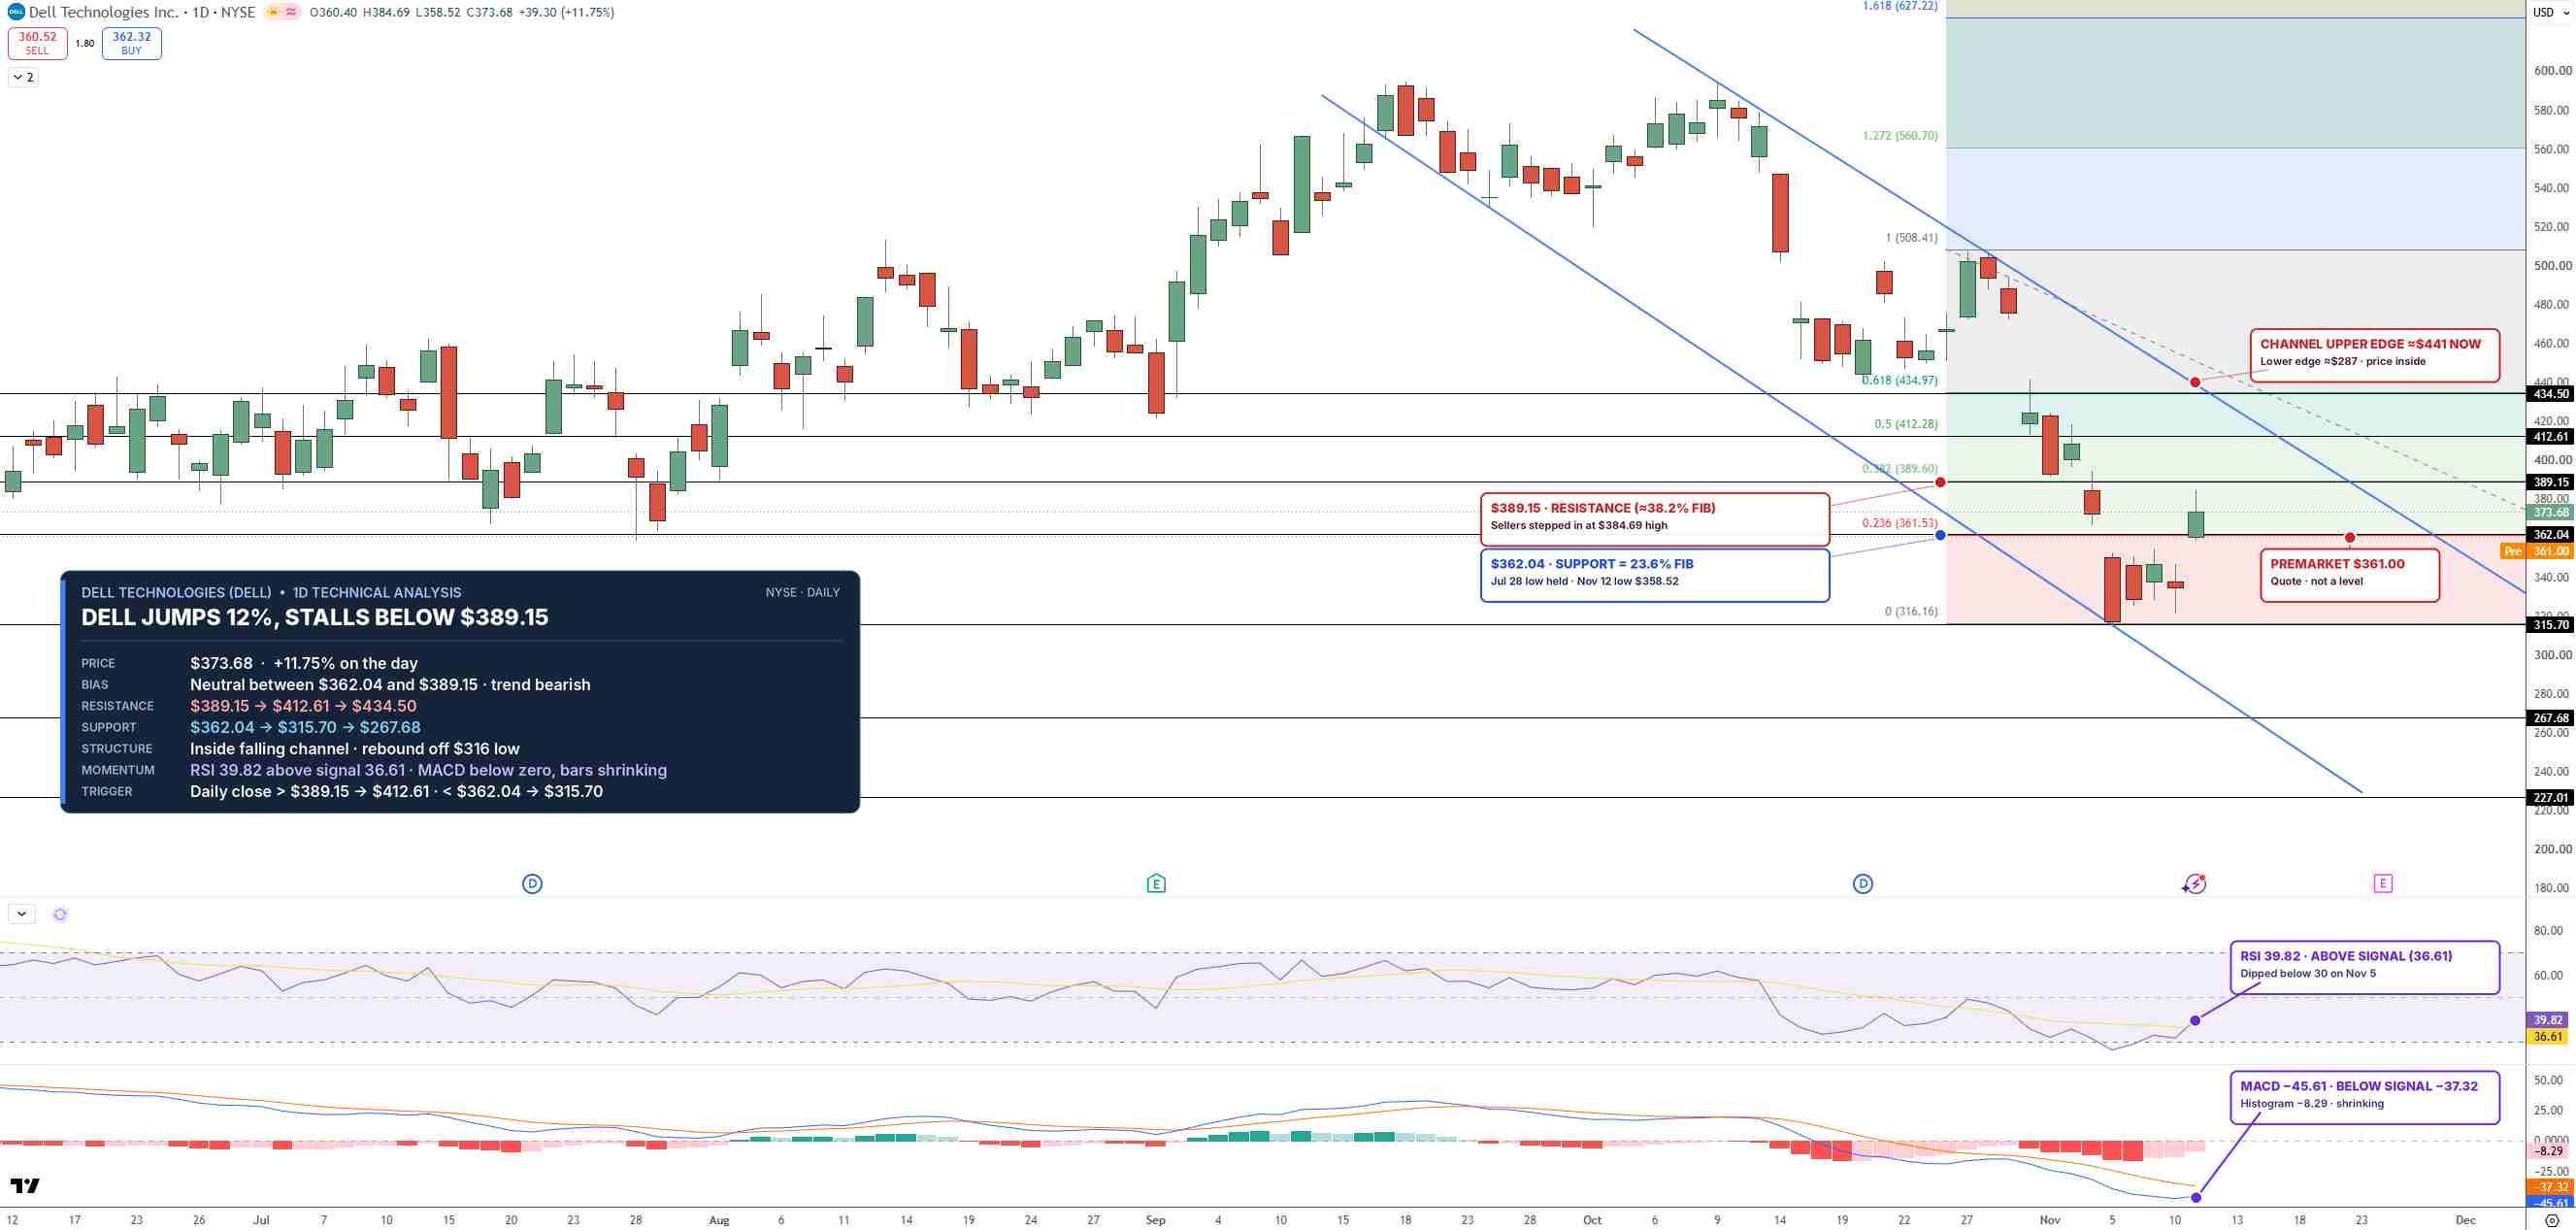
DELL Price Chart - Source: Tradingview
If buyers hold $362.04, a daily close above $389.15 could open $412.61. A close below $362.04, however, could send DELL back toward $315.70.
I'm neutral while DELL trades between $362.04 and $389.15, and a break above $389.15 would turn the outlook bullish.
Key Levels
- Last close: $373.68, up 11.75% on Wednesday, November 11 (premarket: $361.00)
- Support: $362.04, $315.70
- Resistance: $384.69, $389.15, $412.61
- RSI: 39.82
- Bullish trigger: Daily close above $389.15
- Bearish trigger: Daily close below $362.04
FAQs
Why did Dell stock jump on November 11?
Dell rose 11.75% as CoreWeave's results revived bets on AI server demand, lifting Dell, Super Micro and Hewlett Packard Enterprise after a sharp selloff since early October.
What is the Dell stock forecast now?
The bias is neutral between $362.04 and $389.15 on the daily chart. A daily close above $389.15 targets $412.61, while a close below $362.04 could send DELL back toward $315.70.
Bottom Line
Dell's $95 billion backlog shows demand is not the problem, but cash flow and memory costs are. The level that matters is $362.04, which premarket trade is already testing. In my view, holding it keeps a move toward $389.15 possible, while a daily close below it would put $315.70 back in play.
Nothing in this material constitutes investment advice, personal recommendation, investment research, an offer, or a solicitation to buy or sell any financial instrument. The content has been prepared without consideration of your individual investment objectives, financial situation, or needs, and should not be treated as such.
Past performance is not a reliable indicator of future performance and/or results. Forward-looking scenarios or forecasts are not a guarantee of future performance. Actual results may differ materially from those anticipated.
Mitrade makes no representation or warranty as to the accuracy or completeness of the information provided and accepts no liability for any loss arising from reliance on such information.
Recommended Articles


